


Talking Points
-Elliott Wave Theory can provide clues to our location with a trend
-Two opposing scenarios suggest the probability of a bounce is elevated
-Lack of bounce and break below 1178 suggests we’ll likely visit 1105 and possibly 956
The USDOLLAR has been a stellar currency over the past several weeks. That outperformance has also anchored lower the price of Gold. Today, we will look at a possible bearish scenario followed by a potential bullish scenario. We will outline key levels to watch for invalidation of one of the patterns.
Bearish Gold
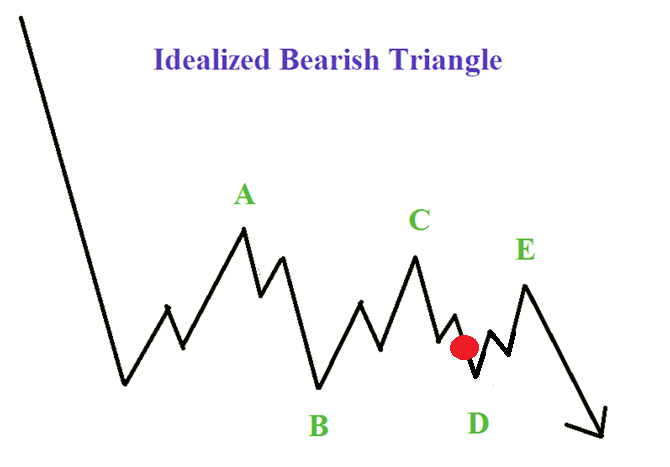
Many traders have been watching the multi-month triangle unfold. This is a bearish triangle that suggests we retest the 2013 low of 1178 and possibly lower. Under the Elliott Wave Theory, triangles are in the position of the wave sequence that precedes an ending wave. Said another way, though the triangle is bearish, the bearish burst lower is an ending wave of a larger degree of trend. Keep that in mind if we push below 1200.
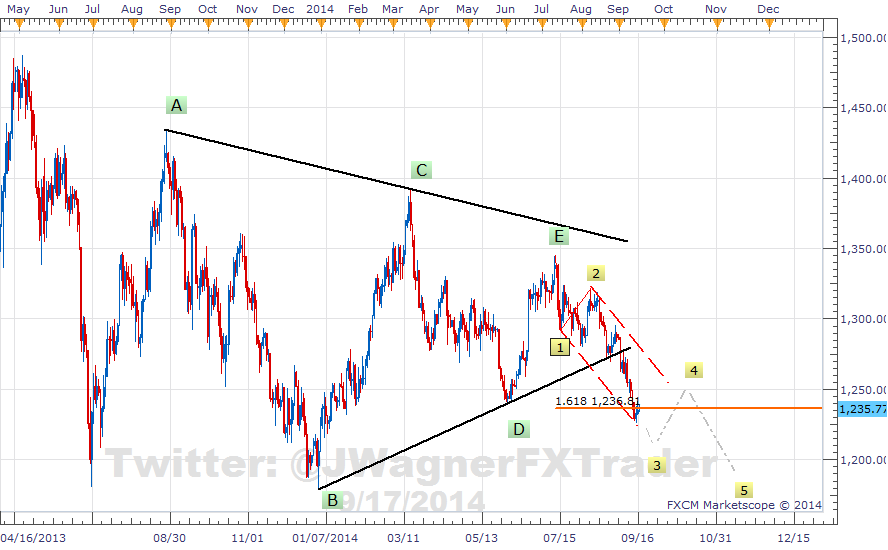
(Created using FXCM’s Marketscope 2.0 charts)
Under this scenario, we’ll look for 5 waves lower to help us fine tune the ending move of an ending wave. It appears we are in wave 3 right now and we can establish some estimates based on Fibonacci ratios where wave 3 might terminate.
The most common wave relationship for wave 3 is to be 1.618 times the length of wave 1. Wave 1 may have finished July 15 at 1292. Therefore, wave 3 may find support near 1236 (see horizontal orange line). Prices have briefly penetrated lower, but are currently holding this line. Prices do not have to bounce from here, but this suggests an elevated probability of a bounce towards 1255 – 1270.
A bounce into the above cited zone would offer an opportunity for bears to re-establish short positions.
Oddly enough, we identified 1235 as a price zone to watch back in June. Therefore, this price zone may still hold strength.
Suggested Reading: Gold Presses Fibonacci Wave Relationship (June 4, 2014)
Bottom line under the bearish scenario, target new lows below 1178 with common wave relationships appearing at the 1105 and 956 price zones. This bearish pattern holds so long as price trades below 1290. (See idealized image below)

Bullish Gold
It is possible the dip below the June 2014 low is simply an extension of wave D of the triangle. Under this interpretation, Gold would need to rally fairly soon for a retest of 1345.
The lows we saw last week at 1225 came right on top of the 78.6% retracement level of the early January to March 2014 up leg.
Another possible price zone that would keep the bullish bounce alive is an equal leg relationship of the ‘D’ leg. This price point is near 1195 which also comes near the 2013 lows of 1178.
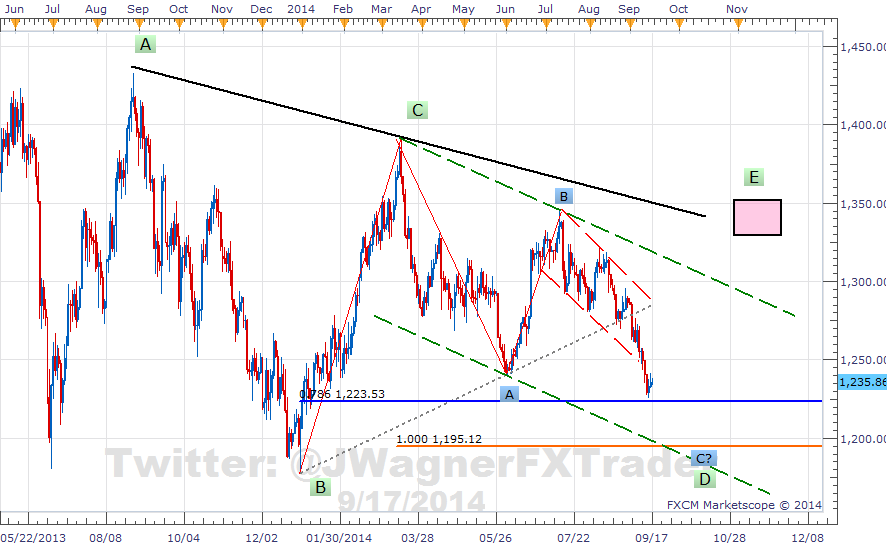
(Created using FXCM’s Marketscope 2.0 charts)
If we are still in the ‘D’ leg of the triangle, then a bullish rally would ensue taking price up to retest 1345. This scenario is invalidated on a print below 1178.
Suggested Reading: Timing Reversals with Equal Waves
Bottom line for this scenario, prices are near a bounce point with another level down near 1195. So long as we are above 1178, respect the possibility of this scenario. (See idealized image below)
Conclusion
As a result, both scenarios taken together suggest an elevated probability of a bounce towards 1255. What happens above 1270 could eliminate the first scenario and lead to gains towards 1345.
On the other hand, a print below 1178 eliminates the second scenario and leads to declines towards 956 and 1105.
A bounce to 1255 that holds below 1290 keeps both scenarios on the table. Keep in mind, Elliott Wave Theory is probabilistic in that these are just two of the higher probability scenarios in my opinion. As market action develops, the more probable patterns emerge.
Let’s see if the FOMC meeting this afternoon presses focus on one of these scenarios.
To receive future articles via email on trading ideas using equal waves, Elliott waves and triangle patterns, click HERE and enter your email information.
Good luck!
Recent articles on Fibonacci and Elliott Wave Trading: EURGBP Looking to Emerge from the Bat Cave
---Written by Jeremy Wagner, Head Trading Instructor, DailyFX EDU
Add me to your Google + Forex Circle.
Follow me on Twitter at @JWagnerFXTrader .
See Jeremy’s recent articles at his DailyFX Forex Educators Bio Page.
This article uses Fibonacci ratios to follow a pattern. To learn more about Fibonacci retracement ratios, register and take this free 20 minute on demand course. Register here.


