Trades above 100 hour MA. Needs to break 200 hour MA though.
Gold has a double bottom near the 1190.25 area. In today's trading, the price moved above the 100 hour moving average (blue line in the chart below –currently at 1204.75). On the move higher, the price also extended above a downward sloping trendline. All these are bullish for gold from a technical perspective.
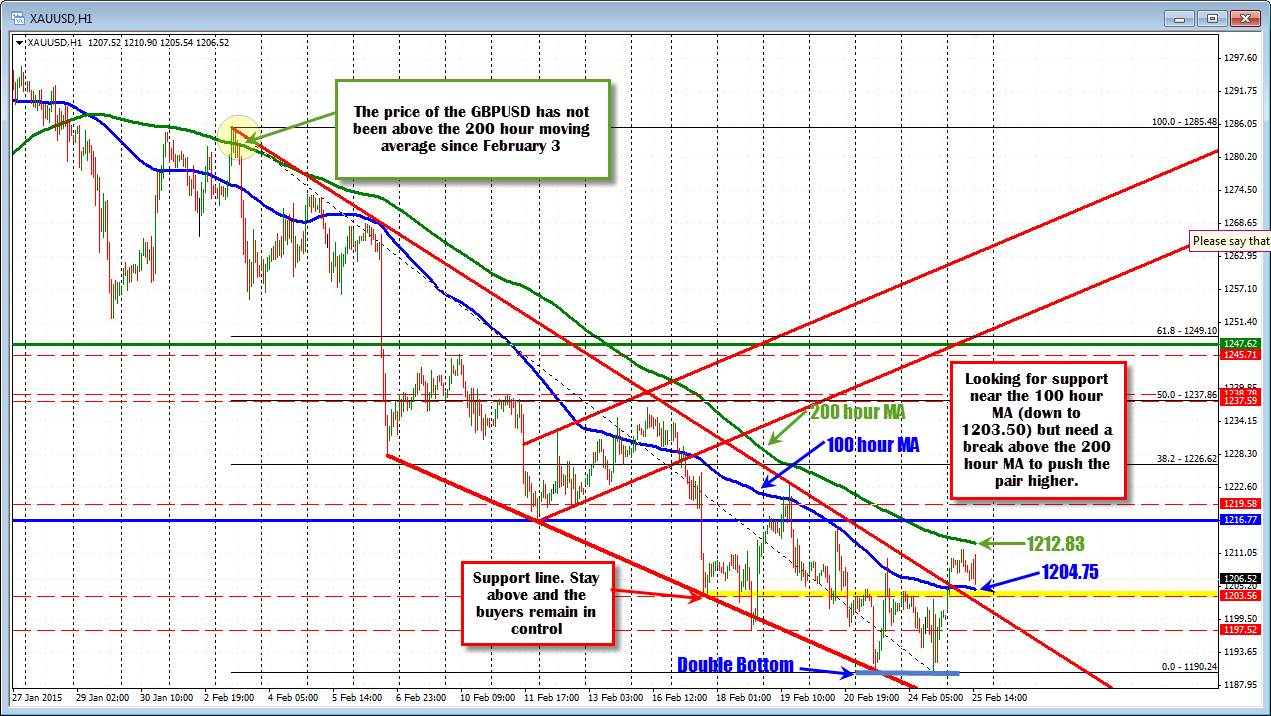
What is not so bullish is that the price stalled before the 200 hour moving average (green line in the chart above). That level currently comes in at 1212.83. If the upside momentum is to continue for gold, a move above the 200 hour moving average (and staying above that moving average) will be eyed. Last time, the price was above the 200 hour moving average goes all the way back to February 3.
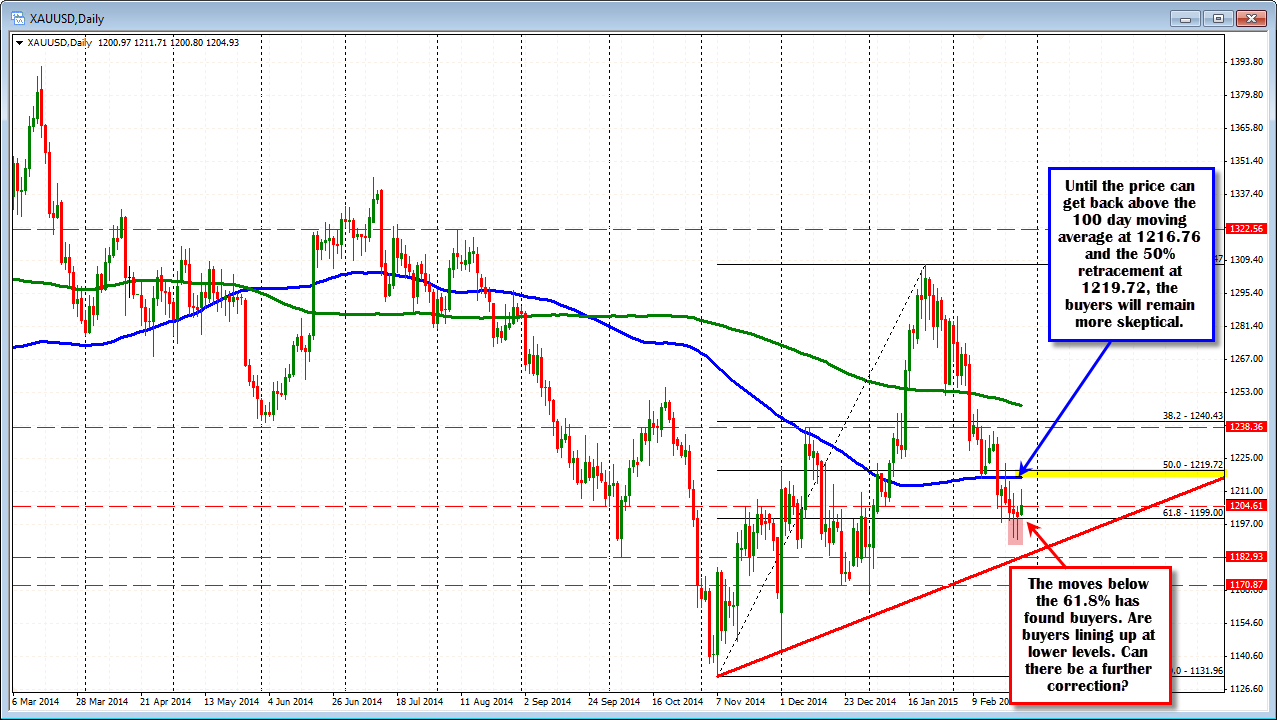
Looking at the daily chart, the picture is not so bullish yet.
- The price has been trending to the downside since the January high at 1307.47.
- In the process, the price fell below the 200 day moving average (green line in the chart below) and then the
- 100 hour moving average (blue line in the chart below currently at 1216.76).
- The price has 7 consecutive day close below the 100 day moving average.
- It is also below the 50% retracement of the move up from the November low to the January high (at 1219.72 currently)
Some positives is the price has moved below the 61.8% retracement level at 1199.00, but has no closes below that level (Let's call it 1200.00). Today's low was above the that 1200 level. Can the market build off of this?
Admittedly, it is a flimsy bullish argument with the other negatives from the daily chart, but if the hourly chart can hold the support at the 100 hour MA area, the bullishness from that development might be what is needed technically to get the buyers thinking a further correction toward the 200 hour MA and then the 100 day MA. One step at a time. Watching support.