| Is the Decline of Base Production Accelerating? | The Oil Drum | WSJ Article - Oil Officials See Limit Looming on Production |
Estimating the World Production Decline Rates from the Megaproject Forecasts
Posted by Sam Foucher on November 19, 2007 - 2:44pm
Oil production is highly pyramidal and almost half of the world production is coming from less than 3% of the total number of oilfields. Therefore, tracking large oil projects seems like a good approach and it is generally easy to gather good information about a few hundreds of important projects. The most notorious studies are from Chris Skrebowski (ODAC) that has tracked megaprojects since 2004 (see references at the bottom of this post). Initially, only projects that could produce 100 kbpd and more were included. In 2007, the last update included also 40,000 bpd and more. However, forecasted increases in new production capacity have been overly optimistic. So what went wrong? They are many possible causes: demand destruction due to high prices, significant project delays, withheld capacity, larger decline of the resource base, etc.. Having a good estimate of the decline rate of the resource base (Most estimates are ranging between 2 and 6%/year) is fundamental for the precision of supply forecasts derived from megaproject database (see Rembrandt's recent post). Stuart is also looking at this problem here.
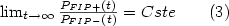
In the following, I assume that I have information about the amount of supply coming from megaprojects for years beyond the year t0. For t >t0, the total oil production will be decomposed in the following components:

Where:
- PFIP+: is the contribution from fields that were online prior to t0 and that are still experiencing production growth or at least a production plateau for the year t>t0.
- PFIP-: is the total contribution from fields that were online prior to 2004 and that are in decline for t>t0 .
- PMegaProj: is the total contribution from new supply additions from megaprojects.
- PSmallProj: is the total contribution from new supply additions from small projects.
If we remove the contribution from MegaProjects, we define a production erosion as following

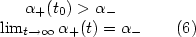
Eventually, after a few years depletion will dominate and most fields will be in decline:

However, fields that have not reached their peak production before will have a non stationary decline rate

The initial decline for the FIP+ group the will be slower but will eventually converge toward the average decline rate of FIP-
A Look at the UK
The UK is one of the only country in the world (along with Norway) that has a detailed public production dataset per field. Therefore, the UK will be our benchmark that can help us partially validate the above model (original idea from Euan). Figure 1 shows an example of production erosion for t0=1998. However, this analysis is assuming that there is no contributions from small projects (i.e. PSmallProj(t)=0 for t>t0).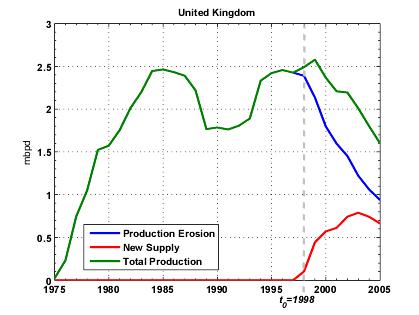
Fig 1. Example of production erosion obtained by removing new supply additions past 1998.

Fig 2. Normalized Production erosion profiles for various t0.
Production erosion rates are initially positives and then drop rapidly within a few years toward a minimum decline rate.


Fig 3. Observed production erosion for the UK when t0 varies between 1990 and 1998. The green curve is the average value.
In order to validate relations (3) to (6), fields are split in two groups, FIP+ and FIP-, according to whether or not they have reached their production peak before t0. Observed average decline rates for FIP+ appear to decline quickly from α+=40% toward negative values and remain nearly constant to a value close to -15% (Figure 4). Decline rates for FIP- are remaining relatively constant around α-=-15%.
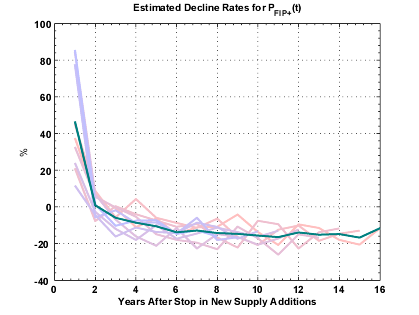

Fig 4. Production erosion annual decline rates for PFIP+ (fields in production that have not reached their production maximum before t0) and PFIP- (fields in production have reached their production maximum before t0).
Another interesting observation is that the production decline post t0 can be closely modeled by a logistic curve which parameters are estimated using the Hubbert Linearization on production prior to t0. On Figure 5, we can see that there is a good correlation between the logistic model and the actual production erosion especially when t0 < 1994 (a corollary conclusion could be also that the Hubbert Linearization is underestimating future supply additions as suggested by Euan).
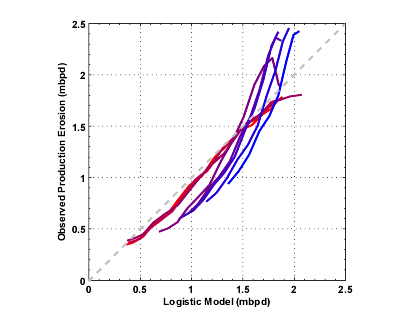
Fig 5. Observed production erosion and logistic model derived from the Hubbert Linearization technique.
Estimating Production Erosion for the World based on the MegaProject Database
The methodology is pretty much the same as the one Stuart employed at the difference that we performed a Monte-Carlo procedure which enable us to inject some degree of uncertainty on the megaproject numbers.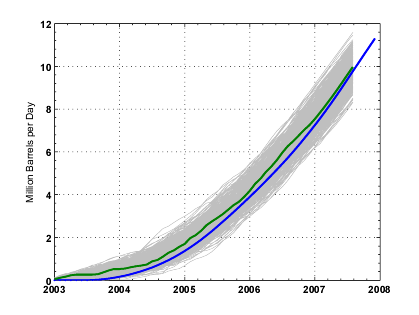
Fig 6. Skrebowski's cumulative new supply additions taken from the 2007 MegaProjects update (blue line) and one variant produced by adding random time delays (uniform +/- 1 year) and production noise (Gaussian noise centered with standard deviation equals to 0.25 mb). In gray, is the domain explored by the Monte-Carlo procedure (500 runs).
The estimated production erosion is shown on Figure 7. The estimated decline rates are linearly increasing over the observation period with an annual increase of 2.9% per year.
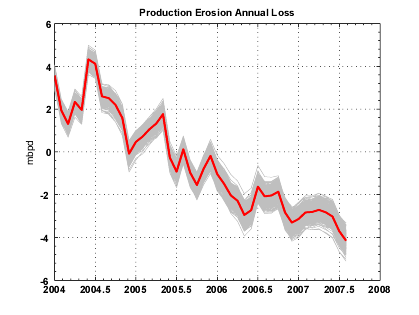
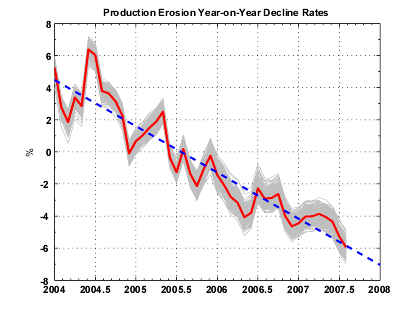
Fig 7. Estimated Annual loss due to Production Erosion (left) and corresponding annualized rates (right). In blue is the linear regression (slope equals to -2.9%/year). In gray, are the range of the estimates (500 runs) and in red the average value.
Having observed on the UK that the logistic model seems to be a good model for forecasting future production erosion, I estimated the logistic model for the world production.
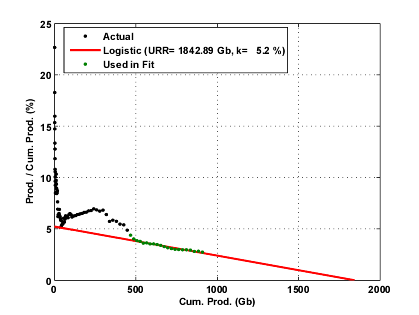
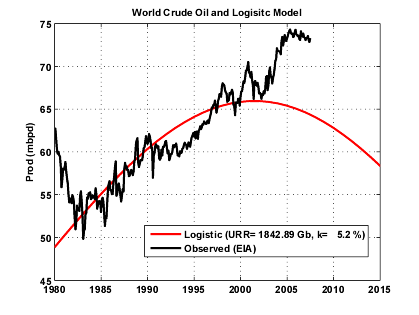
Fig 8. Hubbert linearization applied on the World crude oil + condensate production (EIA data). Only years 1980-2001 are used for the fit.
What's intriguing is that the estimated production erosion (in orange on Figure 9) intersects the logistic curve in 2007. On Figure 9, we are showing different decline scenarios:
- The exponential production erosion scenario assumes that the decline rate will stay constant from 2007 (-4.5%).
- The Accelerated exponential decline has a linearly increasing decline rate according to the blue line shown on Figure 7.
- The logistic scenario is the accelerating decline between 2004-2007 then a logistic decline after 2007.
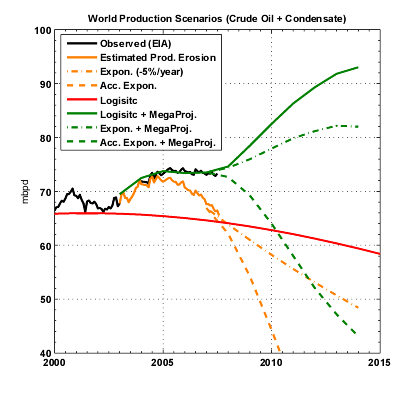
Fig 9. Various scenarios for the world production.
If we look at the production plateau for crude oil from 2005 to 2007, one can notice that the production profile is almost parallel to the logistic curve. Based on this observation, I assumed that the current plateau will continue with a slight downward slope following the logistic decline (see Figure 11). In that case, the production erosion rates are slowing down after 2007 and are reaching a bottom value around -10% in 2012.
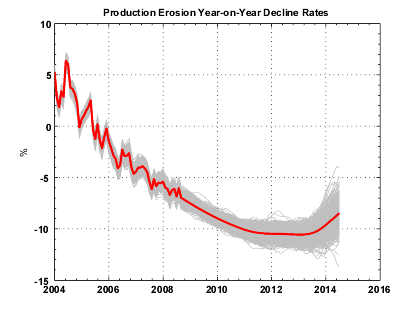
Fig 10. Estimated Production Erosion annualized rates . In gray, are the range of the estimates (500 runs) and in red the average value.
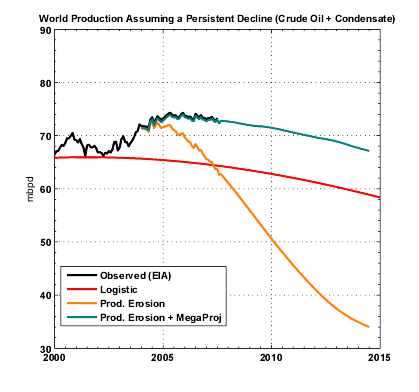
Fig 11. Estimated production erosion assuming a logistic decline for the world production.
Impact of Saudi Arabia Hypothetical Withheld Production
Since August 2005, production from Saudi Arabia has declined by 1 mbpd and is now around 8.7 mbpd (see Figure 12). The question of whether or not this decline is voluntary has been the center of intense debates on TOD. Let's assume that Saudi Arabia would have maintained production constant at 9.6 mbpd since August 2005, the decline rates (Figure 13) would have been slightly less important around -3% for 2007 as well as the acceleration (-2.5%/year).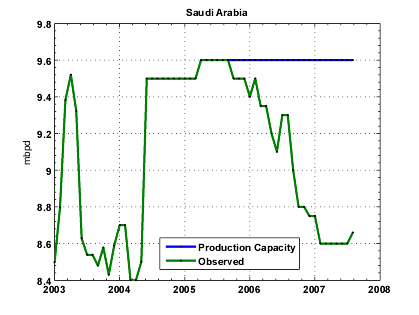
Fig 12. Saudi Arabia crude oil production since 2003 (EIA).
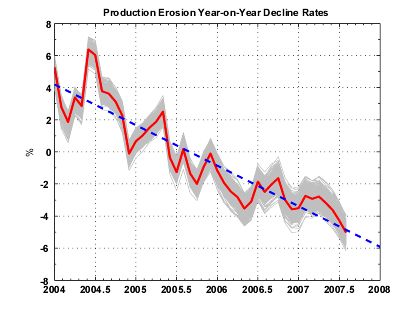
Fig 13. Estimated Production Erosion annualized rates assuming that Saudi Arabia would have maintained production constant since 2005. In gray, are the range of the estimates (500 runs) and in red the average value.

Fig 14. Estimated production erosion and megaproject contribution assuming that Saudi Arabia would have maintained production constant since 2005.
Summary
- We defined production erosion as the production decline of the resource base (+small new projects) resulting from the removal of the contribution from megaprojects.
- We modelised production erosion as a simple sum of three components (FIP+, FIP-, Small projects) which are presenting different decline rates.
- Looking at the UK data as a benchmark:
- we observed that the annual decline rates for the production erosion are not stationary in the first years following the removal of future new supply additions. The decline rate goes from positive values to negative values in just one year and is converging toward a low negative value in 6-8 years.
- the decline rates for FI P+ are not stationary for the first 6-8 years but then are reaching an asymptote.
- the estimated decline rates for FIP- are relatively constant over the years.
- The World production (crude oil + condensate) is almost flat since 2005, however almost 6 mbpd of new supply from megaprojects have been added. We tried to evaluate what is the implication for the underlying decline coming from the post-2005 resource base:
- World production erosion is exponential with a linearly increasing decline rate between 2004 (+4%) and 2007 (-4%) showing no sign of slowing down.
- This accelerating decline is probably the effect of the FIP+ group as we observed for the UK production. The fact that the decline rates seem to be so high is probably a sign that the current world production levels are exceedingly reliyng on new megaprojects in order to maintain production.
- If we assume that crude oil production will continue its slow decline started in 2005 (Figure 11), this implies that decline rates may reach a low around -10%/year around 2010.
- We have absolutely no information on the contribution coming from small projects (probably thousands of them?). However, the fact that we have not removed this contribution should have produced more conservator decline rates.
- The effect of high prices on demand and withheld production in particular from some OPEC producers may bias this analysis.
- Megaproject forecasts are probably excessively pessimistic beyond 5 years simply because the information is not available yet (what we call the horizon effect).
References:
by Chris Skrebowski:New capacity fails to boost 2006 production – delays or depletion?, Petroleum Review, Feb. 2007
Prices holding steady, despite massive planned capacity additions, Petroleum Review, Apr. 2006.
Prices set firm, despite massive new capacity, Petroleum Review, Oct. 2005.
Oil field mega projects 2004, Petroleum Review, Jan. 2004.
Related Stories on TOD
The Shape of Oil to Come, Rembrandt Koppelaar, 2007.A Megaproject list from the Oil and Gas Journal, Heading Out. June 2006.
World Crude Oil Production Forecast using Current Fields and Future Megaprojects, Ace, Dec 2006.
Is a Wall of Oil Heading for the Market?, Euan Mearns, Aug 2006.
Estimating the World Production Decline Rates from the Megaproject Forecasts
PDF version
60 comments
Estimating the World Production Decline Rates from the Megaproject Forecasts
PDF version
60 comments
Contact
- Content: editors at theoildrum dot com
- Tech support: support at theoildrum dot com
License

This work is licensed under a Creative Commons Attribution-Share Alike 3.0 United States License.
I'd like to understand the cause of the difference between your estimate of 2.9% per year in the linear trend of the base production decline rate, and my estimate of 2.2% per year. Is it because of different assumptions in megaproject onset? My assumption is essentially that the projects onset at the end of the tabulation year.
Re: My assumption is essentially that the projects onset at the end of the tabulation year.
I followed the same assumption after seeing your comment yesterday about the way supply additions were tabulated (I still find that disturbing). I got a less steep slope as a result (was originally around 3.4% when I simply used the dates given in Chris's table).
Then I guess the other obvious possibility is because you computed your production changes off EIA (total liquids?), whereas I was using averages of four series. I can check tonight whether that would account for the difference.
No, I used EIA (crude oil + condensates, monthly). I'm going to check in my code also.
Ok - that could well explain it. The EIA C&C line is the most negative of the four I used, so that would tend to give a higher base decline. I'll check quantitatively tonight.
I've redone the calculation using the O&GJ dataset:
The regression is:
5.2963e+3 - 2.64 * Year
R2=0.8552
The 95% confidence interval for the slope is [-2.64 -2.62]. Still higher than yours, whereas using the EIA data I got:
5.7767e+3 - 2.88 * Year
R2=0.8657
The fit quality is slightly better with the EIA.
A couple of comments
1)The graphs in figure 7 don't match.
2)Fig 13. Estimated Production Erosion annualized rates assuming that Saudi Arabia would have maintained production constant since 2005.
If you want to show remove the effects of Saudi Arabia' spare capacity (existent or not) from the graph you should keep its production constant (at 8.6 or 9.6 mbpd) during the entire period.
Re: The graphs in figure 7 don't match.
I don't see it, can you precise?
Re: If you want to show remove the effects of Saudi Arabia' spare capacity (existent or not) from the graph you should keep its production constant (at 8.6 or 9.6 mbpd) during the entire period.
It's a good idea, another suggestion is to estimate non-opec decline rates.
I don't see it, can you be precise?
The scales on y-axis on the two graphs in figure 7 don't match, and the final value is -4 on the upper and -6 on the lower. It appears that you used the same data as in fig 13 for the upper graph of fig 7.
The scales don't match because one is the annual production loss (i.e. P(t+1)-P(t)) in mbpd and the other one is the decline rate per year in % (i.e. P(t+1)/P(t)*100-100). They look almost the same but they are not.
http://science.reddit.com/info/60yji/comments/
thanks for your support...
Thanks again for some penetrating analysis guys. You are indeed close to the root of the problem now. We have been running a field by field model for some institutions close to the action for almost ten years now so we can learn a lot from observation of our own results versus the assumptions made early on. The bottom line here is that running models for several hundred new (post 1997) fields (actually close to 800 now) for some years shows that the assumed profiles for each type are almost all falling well short in terms of achieving peak capacity, maintaining any kind of plateau and sustaining a gradual decline from peak.
Instead, the offshore fields are a) often late b) fall below peak, c) have almost no plateau and d) decline much faster than expected. The trend is progressive so that later fields are performing worse than ever, short lives with faster decline. One might reasonably conclude that advancing technology achieves an objective set by the companies running the projects (in our system mainly private oil companies): get oil out fast, maximise cash and spend as little as possible after the big cash outlay at the front-end.
We have been drilling for cash, harder and faster, and the price of max cash and return is often less oil. This happens first because of what these profiles do to recovery of the nameplate recoverable reserves at project startup, second because the smaller fields don't make financial sense and third because the potential exploration and appraisal of prospects around the existing producing infrastructure offshore is not happening as it might in an maximised oil supply strategy.
We continue to look at oil and liquids supply from the wrong end of the telescope. Consumer states do not have fiscal policies that put oil supply maximisation first. Companies that do the work are employed by their shareholders who want better quarterly results from a long term capex type of business. Exporting countries will adjust capacity where they can to favour orice and then volume, but revenue anyway. From this end of the telescope everything is going to plan: our product is going up in value, there is little or no substitute of any scale and demand has nowhere else to go right now, because oil like most other energy is cheap, cheap, cheap.
Those badly hurt by high energy costs don't really get a vote here (never did really) and by the time demand takes a dip as it did last time around (1980 et al), it will be too late to make smooth adjustments because of the lead times to cranking up high cost (very hight) new liquids.
You guys have seen it coming and so have we. Did anybody listen? Fat chance, since those in a position to make a difference would only lose either fiscal income, windfall profits or share value in the phantom rush to save the world's consumers from supply dislocation and other unpleasant problems.
What next? That's tricky to get right. But if supply does not react quickly at all (and it cannot for lots of reasons), then only demand can move...downwards.
Thanks for an interesting comment. What's your estimate for the decline rate?
Hello Rkshepard,
Well said. Please contact Khebab or SS offline if you are reluctant to post your decline rate on this public forum.
Oh yeah--almost forgot--two terrific keyposts by the TopTODers--Big Kudos for this bleeding edge analysis! Cheers!
Bob Shaw in Phx,Az Are Humans Smarter than Yeast?
We based our model templates on sets of fields of various sizes and development systems offshore on those developed in various eras, mainly those in the decade prior to 1997 and applied them to new fields with revisions after five years. We then measured actual behaviour in each field where the data was credible against the model profile. Result: there are big variations of coure especially in smaller fields, but in general for a set of say 50 Gulf of Mexico fields, the result was between 15% and 20% lower than we projected.
Taken as a whole, the offshore fields around the world have been declining at about 11-12% over the last five years or so,including old and new,big and small, roughly matching the capacity additions coming on stream in each year, until 2005 when we mapped the first absolute net decline more or less since offshore oil took up its position as the main contributor to growth during the long OPEC capacity overhang.
We calculated back in 2000 that the large difference between declared new capacity additions around the world, OPEC and non-OPEC would mean that the surplus capacity would disappear sometime in 2004, which it did, leading to a price spike. So far, so good.
Then non-OPEC offshore net production (new field starts versus declining older fields) dipped into absolute decline in 2005 for the first time and although the new capacity was still coming through, it looked as if that decline would start to accelerate by 2009-10 which looks to be the case.
That shifted the burden for growth back to OPEC and the FSU since onshore non-OPEC is not great either. OPEC has steadily failed to match declared new capacity to actual performance. That is for a good reason: many of the OPEC field projects are just that: projects with no contracting commitment and thus no drilling. No drilling,no oil.
We don't have any better data than anybody else on decline in OPEC's onshore fields in the Gulf but it looks like decline rates are perhaps half that of the offshore set, say 5-6%.
At the IEA, Birol says we need three barrels of oil (liquids) to offset decline for every one barrel to meet new demand growth. There are simply not enough rigs, not enough people, not enough service contracting equipment and certainly not enough investment commitment to handle the hundreds of new projects that are still in the pipeline (or on the waiting list) to match thatlevel of new capacity requirement.
The irony is that the offshore contractors have committed tens of billions of dollars to new offshore rigs because of high day rates and asset values. But how many companies want to take a flyer on exploration and small fields when a well in deep water would cost at least $50-70 million? At the deep water frontier in the sub-salt plays those wells can cost $100 million plus each jn the exploration, appraisal and test phases.
Yet it still takes four to five years after a successful discovery to get production started on any scale and if the field is big and difficult, the cashflows are a long time going positive. It doesn't look like a great proposition on Wall Street (better to buy into some old oil somewhere) and it doesn't look great for global liquids supply in general.
I didn't answer the question, but I do know that defining decline is now the primary target for the international institutions these days and I do not think they know the answers either.
rkshepherd,
This article over at Rigzone says that upcomming lease sales in the GOM had the potential to see big money. And then in October, I think it was, they actually hit record levels, according to Starr Spencer from Platts. I couldn't locate an article that she wrote on this topic, but she did give a podcast interview on 10/05/07 stating the record numbers and recalled the feeling of amazement by observers.
Please comment on the difference between your position and the latest record lease sales in GOM. I am very interested in your response.
Sounds like your seeing what I noticed time at peak production has decreased substantially and post peak declines have increased. As for as the max production rate being lower than predicted thats not something I could have easily found.
Overall of course this results eventually in a shark fin curves as exponentially increasing decline rates kick in.
Any comment on my conjecture that GOM production will actually go into steep decline effectively now ?
RKS - I think part of the problem is the rise in production (larger number of wells), the rise in the % that are off shore and the offshore drilling and service industry being under-sized for coping with service demand.
With rig rates where they are - how many comapnies will be doing sub-sea well workovers etc?
So I think with a massive expansion in service capcity, we will see a reversal from current Production Erosion levels - but in how many years time is the question? But this will just be manifest as a slowing of decline!
There will be over-supply of well service and subsea intervention vessels as well as rigs. The new equipment of all sorts is very expensive so that E&P costs across the board are probably rising much faster than oil price. Further, the financial analysts still reckon that there is a big speculative factor in the paper market that over-values oil and so their consensus still suggests a "real" price level of closer to $65 for 2008 and onwards. The debate in these columns would suggest the opposite: namely that oil is still under-priced in terms of the returns on capital expected by large oil companies.
You are right that there will be a period when offshore rig and service vessel rates will fall as supply gets out of synch with actual upstream spending. But I doubt there will be a huge reaction on the new oil investment side from players who are seeking to protect their returns. It will take time until the Chinese and other importer state companies get up to speed to charge in to new field development at the lower rates of return that their own priorities will allow.
Hello Rksheperd,
Thxs for posting more. Perhaps you might be interested in placing a keypost? I think you could be a valuable, contributing TopTODer.
Bob Shaw in Phx,Az Are Humans Smarter than Yeast?
Yikes. Matt Simmons was right. o_O
I would also add my thanks to list of those who understand how desperately this kind of analisis is needed for the "public"consumption. I am not a math person,but your work is clear,and comprehendible .And scary.{plant more fruit trees}
Khebab and Stuart,
Thank you very much for your hard work and generosity in sharing your work with us and the rest of the world. The data sure looks grim, and I thank you for sharing so that we all aren't blind-sided. Bob Ebersole
Bob I think pretty much all the possible outcomes are now on the table so to speak its now a matter of watching production over the next year. I feel like we will know for sure by the end of 2008 what the real model is. If you look at the graphs we have enough divergence by then to see.
I'll repeat on this thread it would be nice to see the same analysis for the GOM since I think its should represent a precursor to world oil production. Glad to see my scary curve finally in print its been in my head for a while now. I think you can see why it freaked me out.
Khebab - as you know, as a mortal geologist, maths is not my strong point. However, I like thought provoking charts. Your Figure 10 is one of the scarier ones here. If Production Erosion reaches 10% per annum then we will likely observe a very sharp decline in oil production.
Setting aside the myriad political and human behavoiral aspects of oil production, I like to simplify things in terms of Decline / Production Erosion being balanced by new capacity. As oil production falls - it becomes easier to replace production erosion / decline - because the base level is falling (the opposite of the chart shown below).
In the UK, for example, oil production will keep falling. But at some point in the future another "Buzzard' will be discovered, and if at that point our production is down to 500,000 bpd, UK production may shoot up by 50%!
And so lets imagine a situation where the global oil industry, with $300 / bbl is able to bring on 3 mmbpd per year new capacity for a sustained period. If the Geological decline rate in Discovered Developed fields is 6% - then we will plateau at 50 mmbpd (note the chart uses 4.5%).
I'm just wondering if this type of scenario is captured by the current methodology.
I don't believe that 10% is realistic. It means that either we are overestimating new supply additions or underestimating actual production capacity (withheld production does not help). Already, If I maintain Saudi Arabia production at 9.6 mbpd since Aug 2005, the decline rate for 2007 goes down by almost 0.5% (Figure 13).
Similar to one of the previous questions.
How is the projects model handling:
The recent Brazil ocean find, the Chevron find in the gulf of Mexico and the possible Shell Oil Shale work ?
brazil - maybe 1 million bpd by 2015
Chevron -gulf of Mexico Maybe 700,000 bpd by 2012.
Shell oil shale - maybe 1.5 million bpd by 2025
http://www.worldoil.com/magazine/MAGAZINE_DETAIL.asp?ART_ID=2658&MONTH_Y...
==============
http://advancednano.blogspot.com
It all depends on the decline rate if its too steep the underlying economic assumptions fall apart and investment will effectively cease so we probably won't see any of these deepwater projects actually occur. My opinion is that this is indeed what we are going to see unfold in the near future. As the uncertainty and fear grows around oil supplies no one will make the huge long term investments needs to bring even the current projects online much less initiate new ones. I think thunder horse for example will never be repeated.
I was in the middle of the dot com crash and a lot of companies they had a good chance of success if the investors had even continued to make minimal investments failed. So once fear/uncertainty become factors then you can expect a fairly extreme overreaction by the investment community. This of course will make future supply even worse fueling further uncertainty and doubt.
Look back at the Texas oil crash a lot of valid and even profitable companies where taken out in the stampede.
So once fear/uncertainty become factors then you can expect a fairly extreme overreaction by the investment community. This of course will make future supply even worse fueling further uncertainty and doubt.
Right... and your response to this problem is to try to whip up as much fear and uncertainty as possible by predicting $800 oil for 2009. Thank god for socially responsible peak oilers, trying to help their fellow man by "building awareness". LOL
Well I see no real reason this won't happen in fact the scenario that has me concerned is presented in this paper.
If we are looking at exponentially increasing decline rates and the stumbling of future mega projects now on the books and probably a pull back in oil sands development. The the reaction of the investment community to in effect cut the throat of oil production is the correct and sensible one. They are far better off investing in anything but major oil projects at that point. Markets that have been built on lies eventually react harshly and in excess to in effect punish the liars.
The problem is a misinformed market. If you don't want $800 dollar oil in 2009 then what needs to happen is the market needs to be informed and the price of oil increase to 200-250 now and probably less than 500 in 2009 and in addition we need heavy fuel taxes to get the price of gasoline in line with Europe. Or you can continue to play games and let the market overreact when its to late.
You can read the graph in this report and you see why I'm concerned. Also I've thought a lot more about it and the proof that I'm probably right already exists. Purdhoe Bay and the North Sea both developed fairly recently with advanced technology are already in steep decline. And the field declines followed a shark fin pattern. Next these where developed in general with the first generation of advanced technology from the 1970's-1980's. Later developments from the 1990's should exhibit even steeper decline rates. This is GOM and a lot of the ME countries.
http://www.sustainability.murdoch.edu.au/publications/oilfleay/04discove...
Just look at the production curves for relatively modern developments and consider that even these fields where not developed initially with advanced technology development since the 1990's has in general even sharper decline profiles. And the most important factor maximum production in Purdhoe Bay only lasted about ten years. Thats the real problem today this peak production level is getting down to 5 years.
And this phenomena is easy to determine in fact its almost trival look at production profiles for fields started before 1970 1970-1989 and 1990-present. The decline in the amount of time a field is at peak production and steep decline rates post peak is striking and obvious. All you have to do is make these divisions based roughly on technology and then look at time at peak production and decline rates.
If it takes 10 years to bring production online for our current big fields located in extreme conditions and your fields are crashing after 5 years your in deep shit.
More info.
http://europe.theoildrum.com/story/2006/11/19/135819/75
So we are in my opinion going to see most of the production developed since 1990 go into steep decline along with and on top of the fact the the super giants are now probably all in decline some like Ghawar and Canterll could experience fairly steep decline rates greater than 10%. Understand that all the workover drilling since the 1990's that has used advanced technology to extend the lifetime of the older fields is simply pushing them into steep final declines in less that 10 years or so.
As far as I can see, even if the accelerated decline trend we are seeing at the moment continues, it only results in net decline rates of < 2.5%. While quite possibly economically unpleasant, that is very unlikely to result in wholesale panic in the next few years.
Also, your analogy with the dot.com bust is pretty inaccurate - the bust occurred because people started to realize they had grossly overinvested, and there was nowhere near the potential market required to support the valuation of a lot of these companies. By contrast, in a scenario of highish base declines, oil projects will look under-valued, and investment will likely increase. Oil projects being approved now with an assumption of $60 oil will look fabulous at the much higher prices that would obtain if decline rates get worse.
As far as decline rate that all depends on how fast it accelerates the worst case scenario which has no mega-projects coming online and exponential rate increases is the one that has me concerned. The effect of the mega-project could easily be negated with a single above ground event say a collapse of the Mexican government or war with Iran. Then we are faced with accelerated decline rates and no way to overcome them. If we are facing exponentially accelerated decline rates then the flip side is nothing bad can happen or we get into trouble fast. The underlying problem is if we are experiencing exponentially increasing decline rates then its a good bet that a number of positive feedback conditions could trigger political blowback as I mentioned but a broad range of scenarios are possible. For obvious reasons you can explore the full effect of exponentially increasing decline rates in this post but the bottom line is they require effectively perfect conditions or things can go down hill fast. If we are really having exponentially accelerating decline rates then they are a lit fuse on a bag of dynamite. Your just looking at the fuse.
As far as dot.com and investors go I was using it as a example of investor fear it does not matter what the business is once fear sets in your toast. Every business plan is worthless at that point. Investment is 90% trust and going with the herd. Once fear uncertainty and doubt set in you can't raise a single penny. I have way to much experience in this area unfortunately.
Go try and raise money for a condo project today. You can have the best plan on the planet and I bet it won't be funded.
Now I think investors will continue to invest in smaller projects but its obvious they are not going to make a huge change in the oil supply they are lucrative financially. Also in general at this point they are better off buying out existing production so you will see anyone with working oil well and known production do well. But large risky new production is dead. If the price of oil is headed north of 100 dollars and the economy is shaky and peak oil is mainstream are you going to buy a existing small producer or pour 100 million into something that won't turn a profit for ten years ?
You can update the "dot.com" scenario with the several magnitudes greater "Solvency Crisis" today.
http://www.reportonbusiness.com/servlet/story/RTGAM.20071116.r-cover17/B...
"Some banks continued to sell ABCP in the weeks prior to the August meltdown even though many buyers were unaware of troubling warning signs that were evident to banks and discussed at senior levels.
One bank was worried enough to stop selling a leading brand of ABCP.
At least two banks warned the Bank of Canada of trouble in the week before the freeze, although no apparent intervention resulted.
The Caisse de dépôt et placement du Québec spearheaded a plan on Friday, Aug. 10, to head off the crisis of the following Monday, but then puzzlingly disappeared from the market when that day came.
What is clear is that in the face of a financial meltdown, the Bank of Canada, foreign and Canadian commercial banks and institutional investors such as the Caisse had to make snap decisions that had profound effects on investors and the Canadian economy. But since then, many investors – big and small – have been left to wonder why little of this behind-the-scenes turmoil was ever explained to them as they purchased paper.
“If that is accurate, it is a big deception,” said André Belzile, chief financial officer of Quebec pharmacy chain Jean Coutu. His company bought $35.7-million of asset-backed commercial paper from Aug. 2 to Aug. 10 from National Bank of Canada, its bank of 45 years.
“They never,” Mr. Belzile said, “mentioned a thing.”
We've got some $415 Trillion of this to clean up.
All based on "growing" amounts of Free Energy.
Just "stable" amounts will not do.
Hi Stuart,
Surely a decline of 2.5% would be crippling to the economy? For years the economy has relied on increased production/growth to maintain the debt culture. Two years of plateau already appear to be having an impact on the world economy (particularly the US)
Even if we had 0% decline, could our economies handle it?
Gold prices rising, dollar faltering - at what point do you reach wholesale panic?
Pete
My estimate in the past has been that the maximum net decline against which the economy can grow is something like 4%, see also here . Considerable uncertainty, admittedly.
No comment on Shell shale, but in Brazil the new discovery will probably be developed as series of consecutive projects spaced out at intervals over about ten years starting in 2011/12 with perhaps 100,000 barrels a day as a first real stage after an extended well test/early production pilot in 2009. Not much chance of 1 Mbd by 2015 I think. They have gas recovery and delivery problems which means re-injection then pipeline projects and all the rest.
Chevron is part of a big wide trend and will be slow and piecemeal too I guess. Costs are a big barrier and Wall Street (it's the share price you know) will have to be thinking of a much higher long term oil price than is currently in their heads.
Finally we get the worst case scenario in print.
We can safely assume that production declines without outright warfare will be no worse than a accelerated exponential.
And it seems my fuzzy math guess where pretty accurate.
The only thing is the mega project projects production rates are probably still high but at long last we have a lower bound estimate. This is the first time that anyone has presented a realistic estimate of the lower bound for oil production.
You did not finish the graphs but if you did you would find that the variation in total URR for all these trends is quit large with Hubberts orginal 1995 world peak probably giving close to the same URR as your exponential increasing decline case.
Thanks and the good thing is we should easily be able to pick out the right answer as early as next year.
Hey, with you guys knowing everything about peak oil related sources and statistics (and the kitchen sink), there's an efford at Wikipedia to try to get a featured status for the Peak Oil article and there's a need for active editors...
http://en.wikipedia.org/wiki/Peak_oil
http://en.wikipedia.org/wiki/Talk:Peak_oil#Article_Improvement
The thorough analysis by Khebab and Stuart provides independent quantitative verification of statements made by Sadad al-Husseini, former head of exploration and production at Saudi Aramco.
August 21, 2005
http://www.petermaass.com/core.cfm?p=1&mag=124&magtype=1
Now, al-Husseini admits that new project capacity will be just be enough to offset declining production of existing fields. This results in world production being on a peak plateau now.
October 29, 2007
http://www.davidstrahan.com/blog/?p=67
October 30, 2007
Oil & Money 2007, London
http://www.energyintel.com/om/program.asp?Year=2007#speakers
Al-Husseini's chart of the peak plateau
click to enlarge
So 4 / 84.5 = 4.7% decline.
One thing that this exercise by Khebab and Stuart has brought home to me is that once Global production is at capacity, the underlying geological decline is the absolute minimum you can have. There's nothing you can do to reduce it - but multiple ways of increasing it.
Well its the minimum possible without external factors. They can easily act to decrease the worlds oil supply below the minimum geological decline rate. As far as the worlds oil production rates go political issues in Iraq, Venezuela, Iran and maybe some in witheld production in Saudi Arabia have alrady resulted in far more oil not being produced vs the current minimum geologic decline rate. Political factors alone probably account for 4-6 mbpd of oil not being produced right now. A withdrawal from Iraq for example could result in the additional loss of 2 mpd or so of production with the obvious chance of a widening conflict.
In the GOM I believe 46% of the production is from deepwater which is susceptible to another Katrina effect and year now.
The problem with the steeper decline rates is they magnify the affect of any above ground problems. We can expect resource nationalism to intensify as peak becomes obvious.
On the technical side the real depletion rates from using the latest technology are just now being felt. This is wells drilled since the late 1990's.
This is a readable paper about smart wells.
https://txspace.tamu.edu/bitstream/handle/1969.1/5931/etd-tamu-2007A-PET...
If you dig into it one of the important factors is not smart wells but that one of the wells in the north sea was abandoned after 3 years of production. This means for example that production brought online in say 2004 is already being capped today. This fairly significant drop in well lifetimes coupled with significantly higher costs for whats arguably the pinnacle in well technology has just begun to effect world production. The result to date has been that real production has so far been closer to the worst case scenarios. But since the well lifetime effect is not one easily deduced from previous production since its effectively hidden as long as new production is brought online its not clear to me that we do have a good handle on decline rates going into the next few years. But at least from my reading in practically every single case when the various advanced horizontal drilling methods where employed the time at peak production was less than anticipated and decline rates steep than anticipated.
For older fields it seems for reading the report.
And this is a good one for older field workovers.
http://www.dgi.com/support/articles/Successful_Horizontal.shtml
http://www.netl.doe.gov/publications/press/2007/07048-Oil_Recovery_Proje...
http://cms.longbeach.gov/oil/brochure.html
That they did indeed succeed in increasing production but its not clear if this has ended but it seems to have.
The 2003 numbers here
http://www.laalmanac.com/energy/en14.htm indicate only 14,912 barrels produced I don't have later numbers.
Overall given this information it seems that we have in general succesfully overcome the declines in older fields and created new production since about 1995 with wells that have a average lifetime of less than 5 years.
Now what this means to me is that we probably have about 10-15mbd of current production that is susceptible to swift declines and will need to be replaced by new production. Next we still have to deal with increasing decline rates from our older fields which probably requires and additional 10-15 mpd of workover and new production. So in my opinion what we are now facing is the need to bring say 20-30 mpd of production online over the next 5-10 years just to stay even or decline slowly. In effect because of the short lifetimes of the modern wells we have dug ourselves a huge hole. Up to 50% of the worlds production may be coming from wells that have a average lifetime of less than a decade maybe in the 3-5 year range. This means that investment would have to double or triple to prevent steep declines.
Sorry to extend a long post but perhaps their is a simpler way to look at the problem. The production from smaller fields is being discounted to much if you look at yearly data. However if you look at say a ten year interval and the cumulative production from small field development over that time period then they add a significant increment if all the fields remain in production fairly close to peak for ten years. If the small field lifetimes are closer to five years not then not only are they not adding to production in general but newer small fields can no longer make up for the decline of the rest of the small fields. The problem is more obvious when you consider small fields only, in aggregate production from small fields is probably now in steep decline.
its the minimum possible without external factors.
Yes, that's what I was trying to say. The minimum underlying decline may be 4.7% and other factors may lead to it being higher - for example 6%.
An acceleration in decline stemming from a change in the profile of producing assets sounds quite plausible. Poorer quality assets declining more rapidly - and the fleet of rigs etc not large enough to compensate for that.
In Stuart's thread I asked if EOR techniques might be part of the problem causing accelerating decline, given that some people in the oil industry, such as Matthew Simmons, argue that it does not increase overall recovery but rather increases production temporarily at the expense of faster decline later.
"The greatest shortcoming of the human race is our inability to understand the exponential function." -- Dr. Albert Bartlett
Into the Grey Zone
GZ - if you see my climbing graphic up the thread this strives to make the simple point that the higher production goes the more new capacity is required each year to compensate for underlying geological decline.
So my feeling is that one way to view EOR is simply that this has contributed to overall higher production levels - which makes the task of compensating for decline all the more difficult.
Some EOR techniques, such as miscible gas flood, definitely lead to higher eventual recovery - because these are designed to move oil out of narrow pore throats that would otherwise be permanantly stuck there under water flood conditions.
Another example though is the West Troll Gas Field in Norway. This had a "thin" oil rim - about 20 ft thick below the gas over a vast area. Norsk Hydro did a vast amount of work during the 1980s modelling the production of this oil using horizontal wells which was enacted during the 1990s. W Troll ended up being Norways single largest oil producer - but when the water and gas hit the wells, decline was very rapid. So what we have here is higher production that declines quickly. Would it have been better to leave the W Troll oil in the ground?
I think you are missing my point, Euan.
World estimates of URR have grown over the last few decades based in part upon EOR techniques. But I have never, ever seen any documented studies that indicate what the real increases might be from EOR techniques. Instead I see lots of hopped up Madison Avenue style yammering from various firms (and I live in Houston, Texas so yes, I see it) without anything substantive to back it up. This brings into question URR estimates if Simmons is even partly right because if the area under the curve is constant but we've raised production (but not URR) via EOR techniques, then our decline profile might look more like the red line than the black line:
To the best of my knowledge, there is no justification within the oil industry for the increases in URR that have been predicated upon EOR techniques. All such increases are purely anecdotal and lack any peer reviewed scientific validity. They are applied field by field and sometimes the results are disastrous (witness Yibal). I am unaware, even within companies that sell such services to other oil companies of any database that would indicate that there is any specific expectation of increased URR. All that it boils down to is a chance, a maybe, a possibility and quite frequently everyone assumes that the possibility will work for them "for sure" and often it does not.
I suppose my question boils down to "What is the real shape of the global production curve?" On this website we have tended to assume that it would be roughly symmetrical, perhaps with a somewhat longer tail, based upon the US experience. But the US experience predates many of these EOR techniques and very clearly at least some giant fields (Yibal) have behaved radically differently than IOCs expected when EOR techniques were applied. And giant fields, as both Robelius and Khebab note, are where the oil is at. Khebab says at least 50% of all oil from 3% of all fields and Robelius goes further stating 60% of all oil from 507 fields (1%). Either of those estimates indicates the absolutely massive dominance of giant fields in global production and the potential disaster if those giant fields do not perform as expected (Yibal).
"The greatest shortcoming of the human race is our inability to understand the exponential function." -- Dr. Albert Bartlett
Into the Grey Zone
Greyzone by taking a novel approach of a priori assuming that 50% URR happens when a region reaches 50% average water cut.
Then giving a hand waving proof.
I've come up with exactly the same result and I believe proven what you just said.
http://www.theoildrum.com/node/3272#comment-267578
And better with a completly different approach I get EXACTLY the same results as Hubbert did in 1980.
We have a real URR of 1250 barrels and we are now 80% depleted.
You are way outside the reasonable range Memmel. That implies there's only 250gb left, which is totally inconsistent with the amount of OOIP.
And my opinion from looking at a lot of different information sources is that production since about 1995 used to both replace decline and also give us our 10mpd boost in production has generally been of the unsustainable variety. If you look at discovery curves.
This paper does a good job of laying out the problem.
http://www.mbendi.co.za/indy/oilg/p0070.htm
In my opinion discovery peak should be shifted to give a production peak between 1985-1995. Production increases since then in my opinion are not backed by discovery. I also happen to question the more recent discovery numbers and URR estimates since 1980. I suggest that they could be vetted for accuracy. I think you will find a clear trend of increasing optimism later. This is simply because oil discovery and reserve estimates became fairly political from the late 1970 onwards even in the western countries. Previous to this you had far less reason to inflate reserve estimates. Shell in a sense got caught. But how many other downgrades should have been performed ?
http://thescotsman.scotsman.com/business.cfm?id=315432004
The point is it may be prudent to consider discoveries and reserve numbers post oil embargo with a grain of salt or maybe a big sack.
In any case its obvious at least to me a lot of the current production rate is driven by technical improvements that have resulted in a well lifetime of 5 years or so and are unsustainable. What I call our real base rate production which is longer lived wells 15-30 years is probably only about 40-60 mbd now. The rest of the production will need to be replaced effectively every 5 years which is impossible.
On the plus side our technical ability to extract oil from a field at a high production rate is nothing short of astounding the more I read about oil well technology the more impressed I become with our technical capabilities. But this does not bode well for future production.
Bingo! The geologic decline is the minimum. It can and very probably will get much worse.
"The greatest shortcoming of the human race is our inability to understand the exponential function." -- Dr. Albert Bartlett
Into the Grey Zone
Great stuff!
If you haven't seen it, Kjell Aleklett's student Frederik Robelius did a very good study, Giant Oil Fields, which was similar to Skrewbowski's megaprojects analysis, earlier this year.
--C
Energy consultant, writer, blogger www.getreallist.com
It looks like something slightly better than Robelius' worst case scenario might become reality.
"The worst case scenario peaks at just above 83Mbpd in 2008". (page 129 of Robelius' study)
click to enlarge
Note that Robelius' oil production includes crude oil, condensate, natural gas liquids and processing gains. (biofuels, coal to liquids and gas to liquids are assumed to be excluded - p 125)
Thanks, Khebab and Stuart. Excellent as always.
Looking at his worst case scenario (82 to 25 mbpd in 40 years):
exp(log(25/82)/(2050-2010))-1= -3%
is assuming a decline rate around 3%.
In this context, what do you mean by decline rate?
Khebab,
The articles by you and Stuart have made the top of the list of oil-related articles listed at 321energy.com.
That should get some more eyeballs. Good job!
In the most recent megaprojects I noticed the following listing: for onstream production in 2006
"Syncrude Phase 3 Athabasca, Canada Canadian Oil Sands 350,000 bbl/day"
Now from memory, phase 3 was supposed to increase production by approx 125,000 to give a total production at Syncrude to 350,000 bbl/day. Not to add 350,00 bbl/day in total for the 2006 phase 3 project.
That is a grossly inaccurate figure posted on the megaprojects latest list. Chris needs to check his work more carefully - when it comes to oil/tarsands. Only 70% the publically stated figure? Not even close.
Has anyone else checked how close or accurate the megaprojects listings are? even just a little bit?
Another overstatement on the mega projects list:
For the long lake project in the megaprojects list, due to come onstream in 2007
"Long Lake (tar sands) Canada, N Alberta Nexen 70,000 bbl/day Nexen 50%, OPTI Canada 50%"
Back in reality land, they will actuallyt achieve 58,500 bbl/d by mid 2009.
Plus, it appears to me that when Chris counts oil/tarsand projects, in his megaprojects list, he is counting bitumen which is not refinery ready so it won't be helping transports fuels (etc) much without sufficent upgrading capacity. That would take much longer and far more captial - extending the projects useful output start date another 3-6 years.
So there is more over-counting here too.
I would bet that overall the megaprojects list is over optimistic on production numbers. - At the very least, they definately are for oilsands.
We've had other similar complaints by email, so the quality of the list has become a concern. Whether these issues are isolated, or sufficient to make Chris's annual statistics misleading is not clear. We are working on an approach to this (I'll let Khebab announce when he is ready).