
Gold seen some heavy selling on Monday mornings open with the market taking out a number of stops in thin trading conditions. The market did erase the majority of the sell off after finding solid buying interest on the 50 Fibonacci level at 1087.75, now as long as this level can continue to attract solid buying interest the bulls will remain in control in this degree, however, any break of the 50 Fibonacci level could see the selling pressure continue to pick up on the downside.
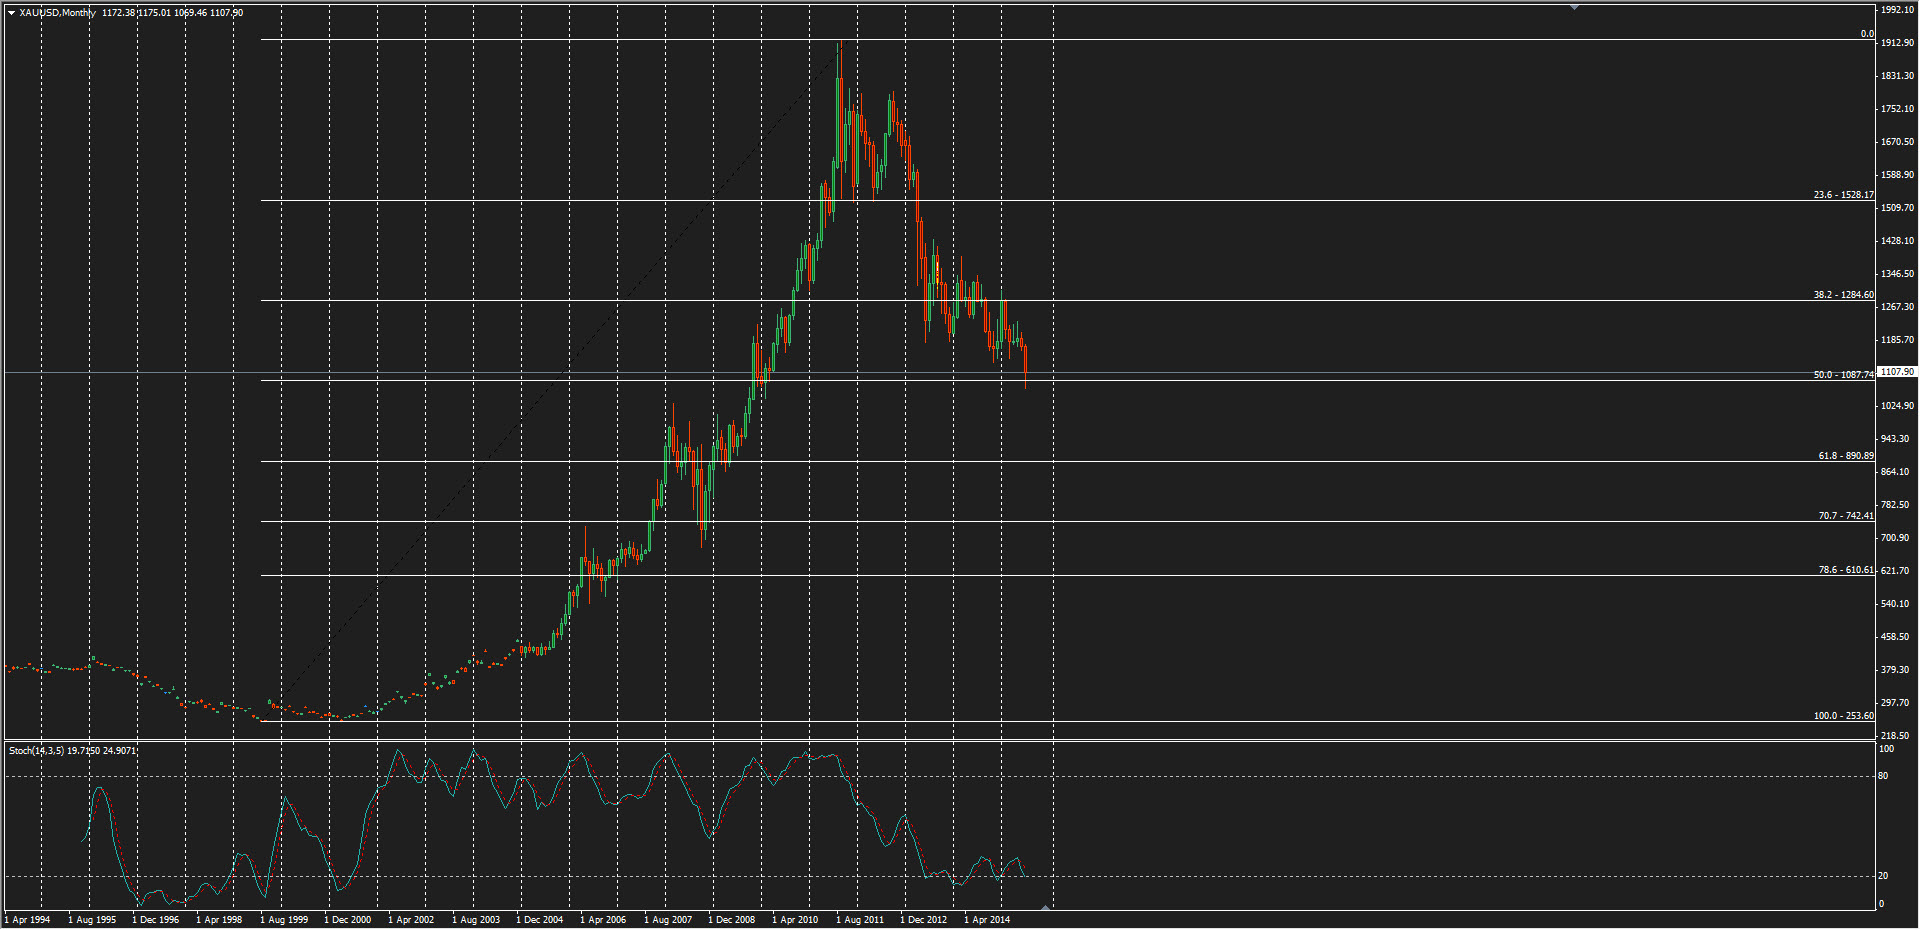
Gold Monthly
Moving down to the weekly chart we can see that the next important level to keep a close eye on according to Elliott Wave theory will be the Wave 5 (Green) that will be of equal length to Wave 1 (Green) at 1030.50. This Wave 5 (Green) will complete the Elliott Wave cycle on the downside.
If this level is tested in the coming weeks I would expect solid buying interest on the first test. A break of the Wave 5 (Green) would see the bears take full control of this market with the next support not seen until the 61.8 Fibonacci level at 890.89.
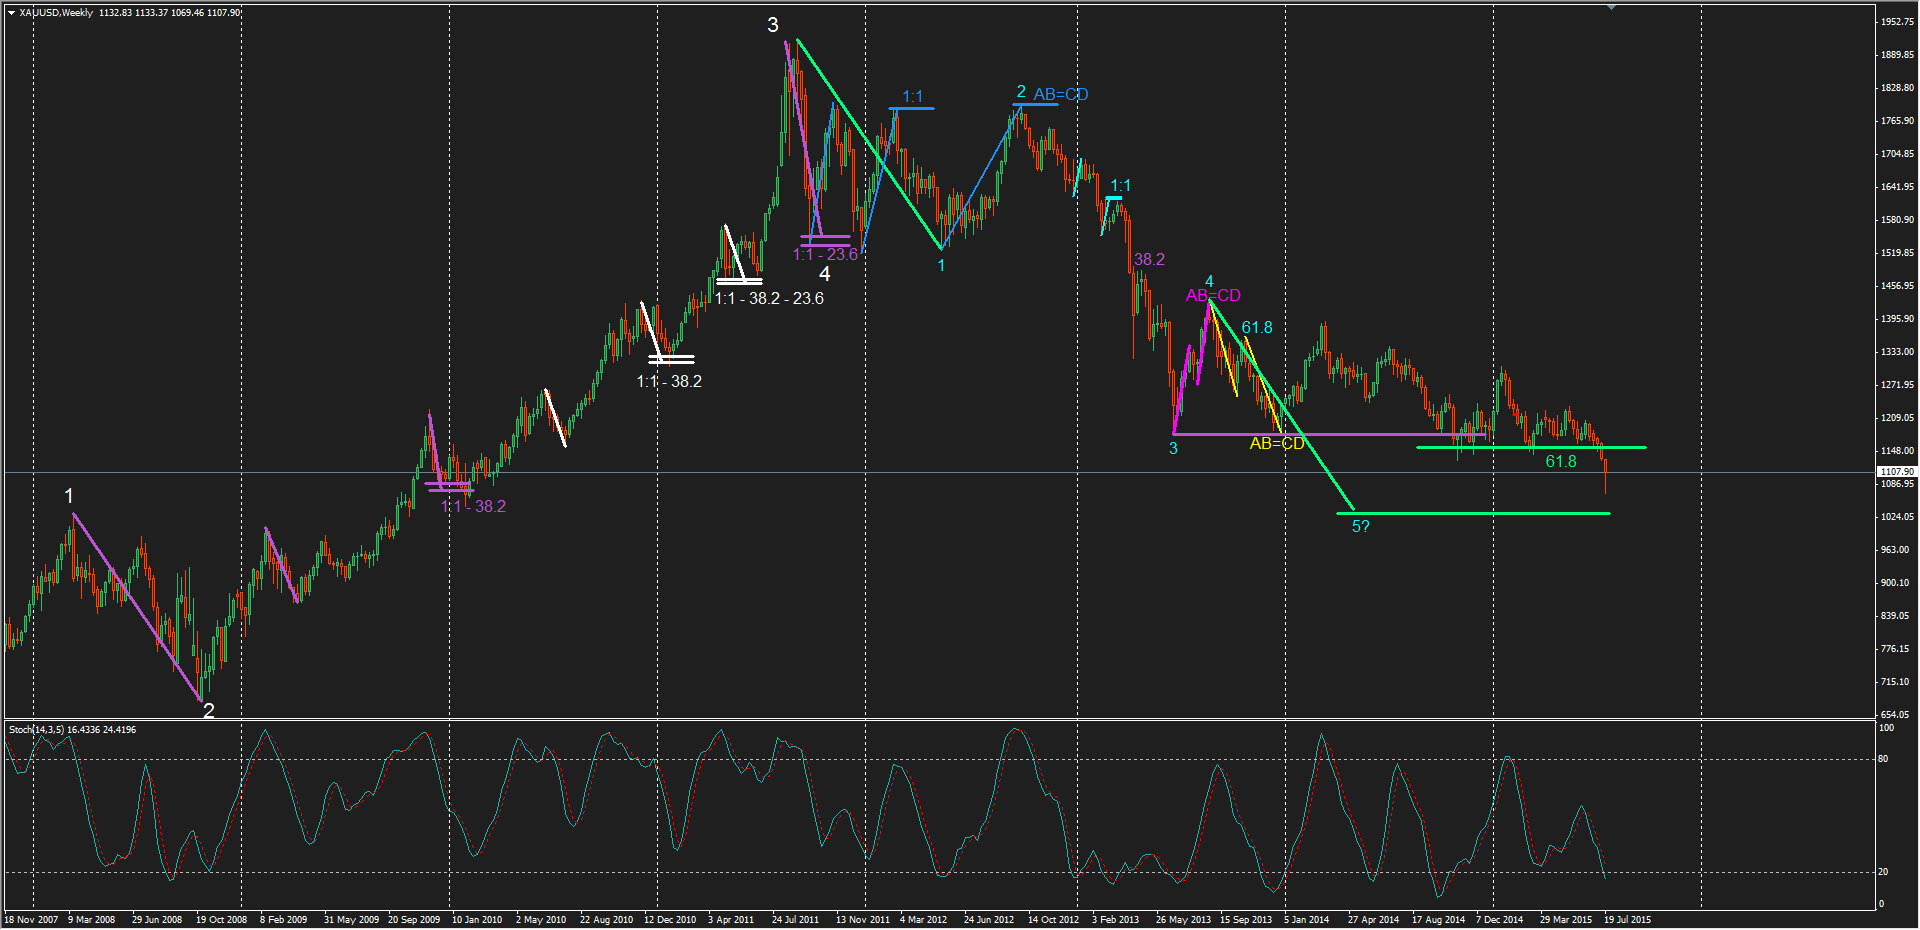
Gold Weekly
Bears were seen continuing to sell into gold on the 1:1 (Yellow) at 1114.40 during yesterdays trading session. As long as the bears can continue to hold the market below this level the selling is likely to continue, however, a break back above the 1:1 (Yellow) will see some further short covering take place.
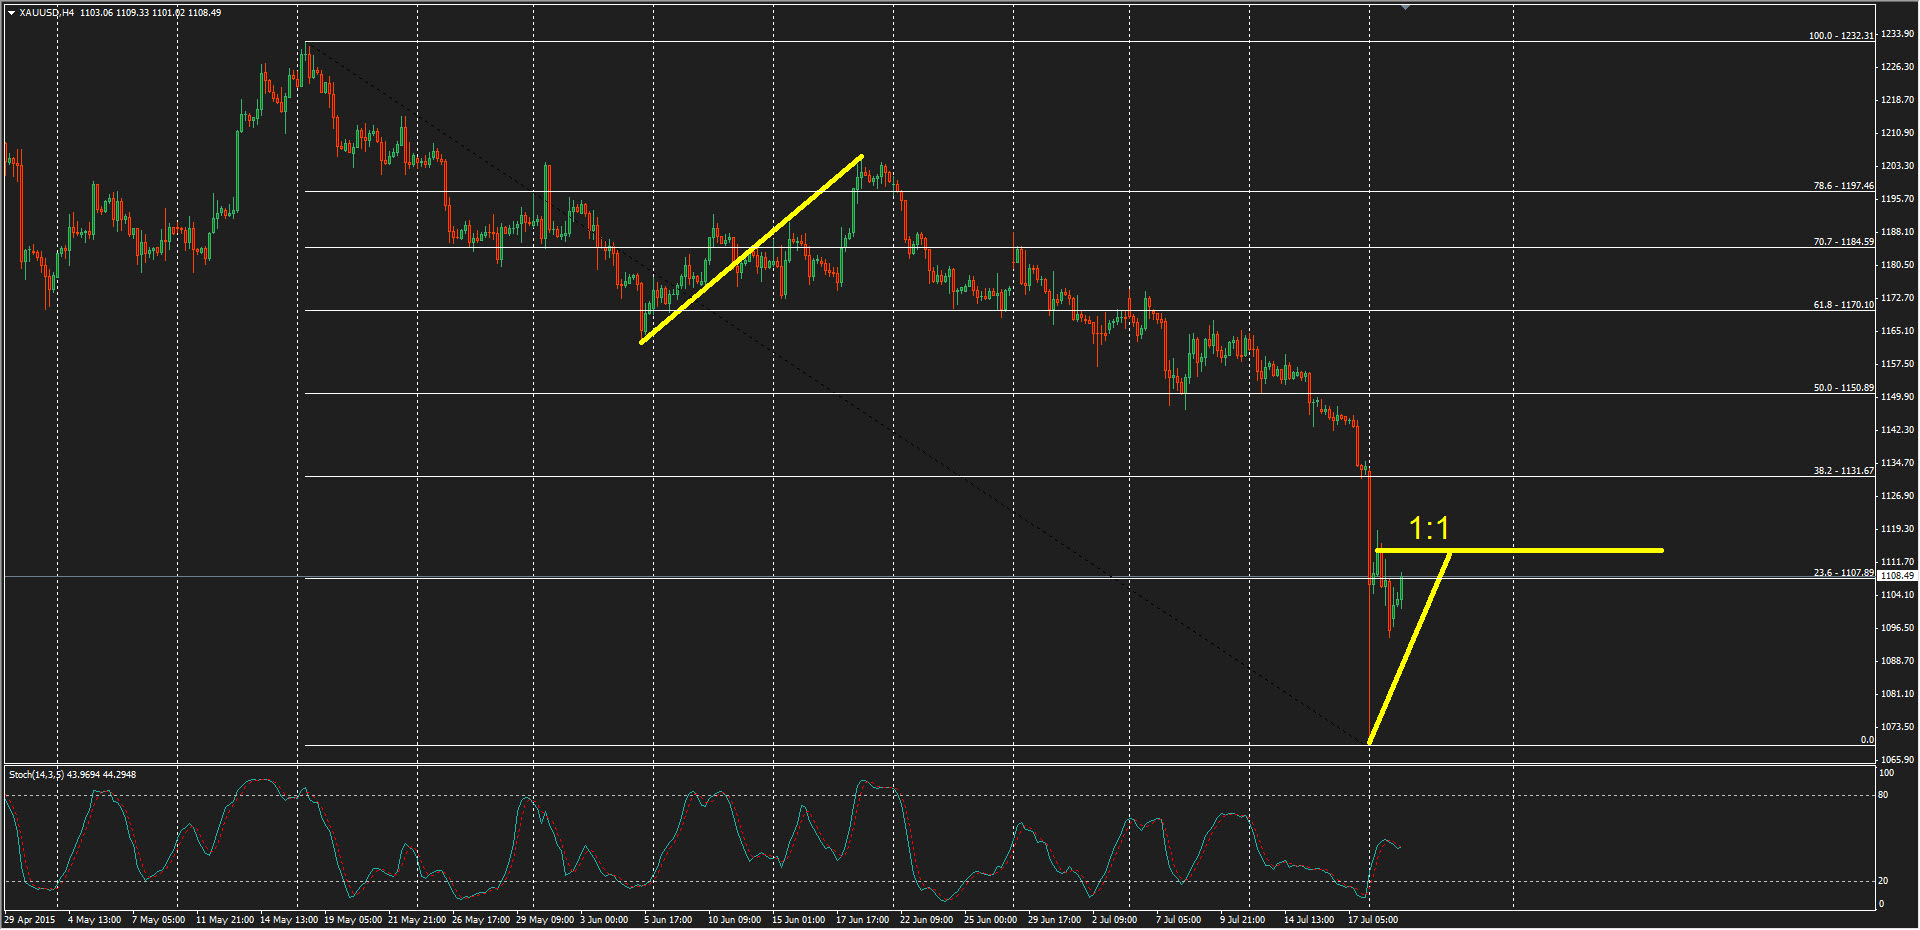
Gold H4
* A 1:1 refers to a current correction being equal in length to a prior correction

