
On October 7th, I did a video on Gold. The price had reached a floor and there were other technical clues that suggested a bottom and could also define and limit risk. The price moved higher and has reached the the target outlined in the video near the 38.2% at the 1236 area (see video Gold Technical Analysis: Is the bottom in? (October 7, 2014). I said at the time it was the minimum target with the 1252.76 level (the 50% retracement) as another potential area.
Gold has stalled against the 38.2%, the low from June and the low from end of Jan too
Well, the price reached the target over the last few days,and we are seeing a stall. Can Gold continue to go higher?
Let’s take a new look.
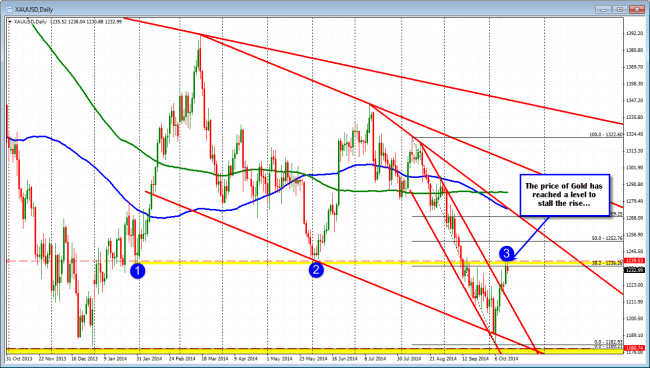
The daily chart shows the reasons for the stall, The 38.2% retracement is there, the low from June is nearby at the 1240 level (the high has reached 1238.04). The low from January 30 comes in at 1238.00. So that is the cause for pause. Now what?
If the price goes above this area, it is likely to trigger more buying and the next leg to the 1252.76 level will be the target (50% of the move down from the August high).
What is the hourly chart saying?
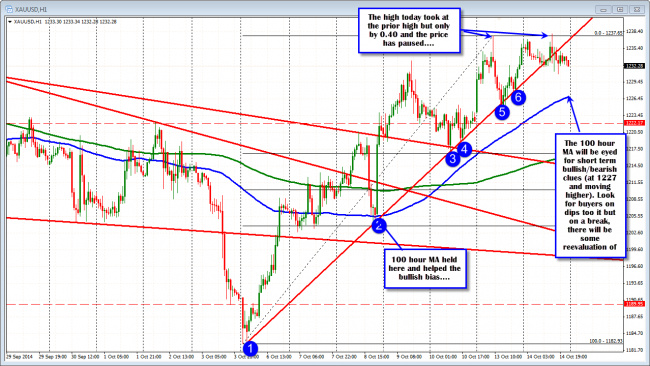
Looking at it, the price has been tracking above a trend line and the 100 hour MA. On the FOMC meeting minute day, the price had a quick drop and then an equally as fast move higher. The low on that day tested but could not close below the 100 hour MA (see chart below0.
Today, the price has “sideway-ed, it’s way” below the trend line with the last 7 or so hourly bars trading below the line. This comes after a new high today (1238.04 vs 1237.65) failed. Disappointment on the lack of momentum is another potential red flag for the upside.
Gold is showing some signs of slowing.
Traders who are long can take partial profit here. We are still above the 100 hour MA (blue line in the hourly chart above) which is bullish. However, we know of the strong resistance. We are showing a more balanced market. If the price goes above the aforementioned resistance, you can always buy back what was sold, or simply ride the rest with the 50% the next target – if the price can stay above the 38.2% retracement level (look for a momentum move on a break above the 1238 area).
If the price does go below the 100 hour MA (blue line in the hourly chart above), then there is something else going on that has the sellers more in control (RISK LEVEL).
With stocks under pressure and fear from lots of stuff (including Ebola, a global slowdown,etc) would that not make Gold attractive? Not if inflation is not running away. Traders might resort back to old story that “Gold is an inflation hedge” That relationship is not the only thing that drives prices of Gold of course, but it might become a story (there can be many stories to explain golds moves on a day-to-day basis or even month-to-month including the dollar, geopolitical risk, etc.).
For me, the technical’s tell a story too and that story is saying there is a cause for pause. We will see what the next chapter says going forward on a move above the 1238 area (again look for momentum above) or on a move back below the 100 hour MA (at 1227 and moving higher).

