


Talking Points:
- US Dollar Flat-Lining at Familiar Range Floor Support
- S&P 500 Consolidating Gains After Hitting Record High
- Crude Oil, Gold Price Action Stalls at Technical Barriers
Can’t access the Dow Jones FXCM US Dollar Index? Try the USD basket on Mirror Trader. **
US DOLLAR TECHNICAL ANALYSIS – Prices look to have reversed downward as expected after putting in a bearish Evening Star candlestick pattern. A daily close below the 14.6% Fibonacci retracementat 11740 exposes the 23.6% level at 11653. Alternatively, a turn above the 11854-76 zone (14.6% Fib expansion, March 2009 high) clears the way for a test of the 23.6% expansion at 11963.
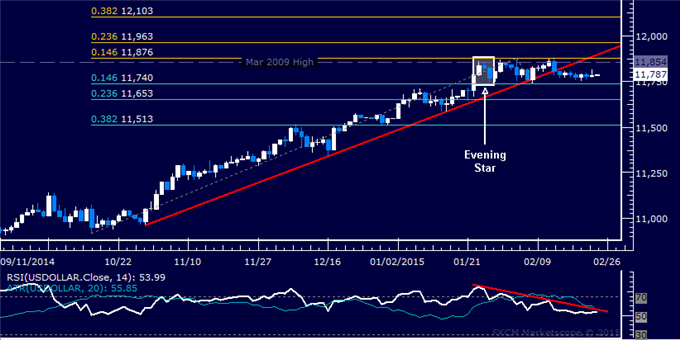
Daily Chart - Created Using FXCM Marketscope
** The Dow Jones FXCM US Dollar Index and the Mirror Trader USD basket are not the same product.
S&P 500 TECHNICAL ANALYSIS – Prices paused to consolidate after establishing a new record high. A daily close above the 23.6% Fibonacci expansion at 2113.60 exposes the 38.2% level at 2131.30. Alternatively, a reversal below the 14.6% Fib at 2102.60 targets the February 20 low at 2084.90.
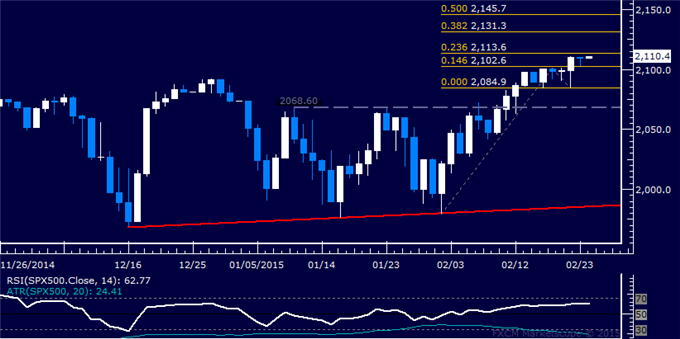
Daily Chart - Created Using FXCM Marketscope
GOLD TECHNICAL ANALYSIS – Prices challenging pivotal support at 1197.86, the 61.8% Fibonacci retracement. A break below this barrier exposes channel floor support at 1176.34, followed by the 76.4% level at 1171.96. Alternatively, a reversal above 50% Fib at 1218.80 targets the 38.2% retracement at 1239.73.
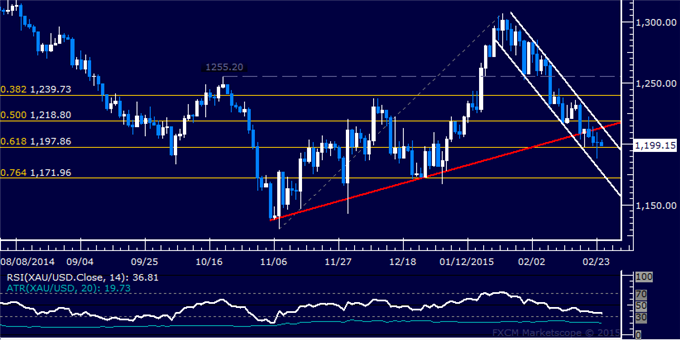
Daily Chart - Created Using FXCM Marketscope
CRUDE OIL TECHNICAL ANALYSIS – Prices are digesting gains below the $64/barrel figure after reversing upward as expected. A break above the 50% Fibonacci retracement at 63.38 on a daily closing basis exposes the 61.8% level at 67.68. Alternatively, a reversal below the 38.2% Fib at 59.08 targets the 23.6% retracement at 53.77.
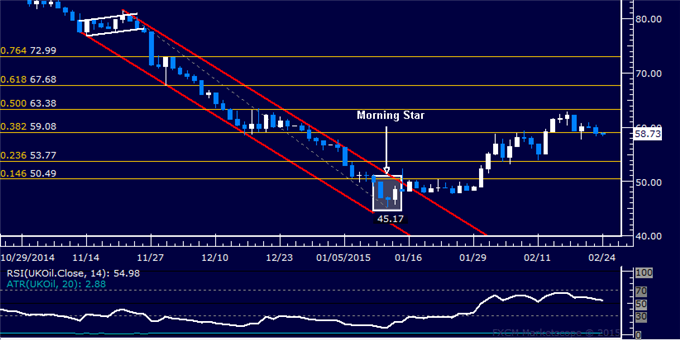
Daily Chart - Created Using FXCM Marketscope
--- Written by Ilya Spivak, Currency Strategist for DailyFX.com
To receive Ilya's analysis directly via email, please SIGN UP HERE
Contact and follow Ilya on Twitter: @IlyaSpivak


