![]()
As reflected in the falling price of gold over the past three sessions, traders are clearly not feeling confident that Switzerland will vote ‘Yes’ on Sunday’s referendum on the Swiss National Bank’s gold reserves. The proposal would require the SNB to hold gold reserves equivalent to 20% of its total assets. Not only that, but all Swiss gold held with foreign central banks would need to be repatriated and the SNB would never be allowed to sell them in the future. Some might argue, what’s the point then? Clearly such a commitment would make it extremely difficult for the SNB to effectively achieve its monetary policy objectives and may even be forced to abandon the 1.20 peg in EUR/CHF. So, I am extremely sceptical that the Yes vote will win. Thus it is likely that the gold price would not only move sharply lower on Sunday night, it could even gap down as the market prices out the possibility of SNB purchases. On the other hand, if the Yes vote wins, gold could absolutely soar as this would mean that the SNB will need to accumulate some 1,500 tonnes of the yellow metal – a huge amount – over 5 years. My colleague Kathleen Brooks has written more on this in greater detail – click HERE to view her article.
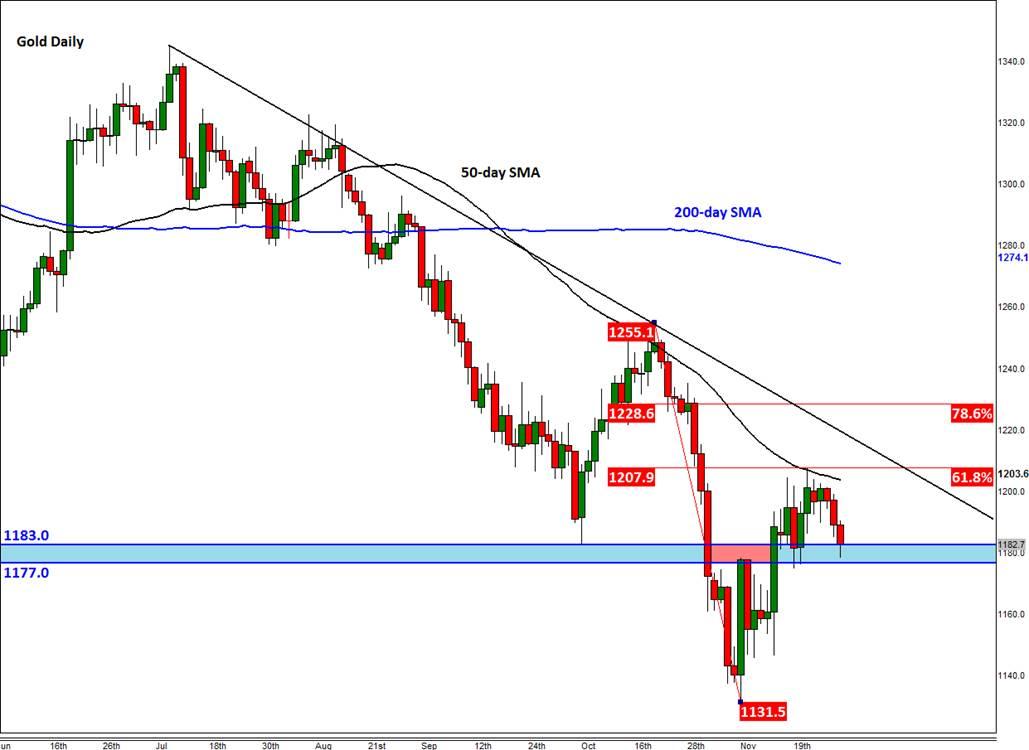
So, there is potential for a sharp move in the price of gold – and indeed the EUR/CHF currency pair –on Sunday night. Traders should therefore watch their key support and resistance levels with extra care. Below I have attached two charts of gold – the daily and 1 hour time frames. On the daily chart (figure 1), it is clear that the longer term trend is still bearish, even though price is holding above the key $1170 to $1183 support range, or more generally the area round $1180. This region had been support and resistance in the past. So, a potential closing break below here today could attracts fresh selling next week, particularly if the ‘No’ camp wins the referendum on Sunday. The key resistance level to watch is the area between the 50-day moving average and the 61.8% Fibonacci retirement level at $1203.5 to $1208.0. Beyond this level there is the bearish trend line and then the 78.6% Fibonacci level at $1228/9.
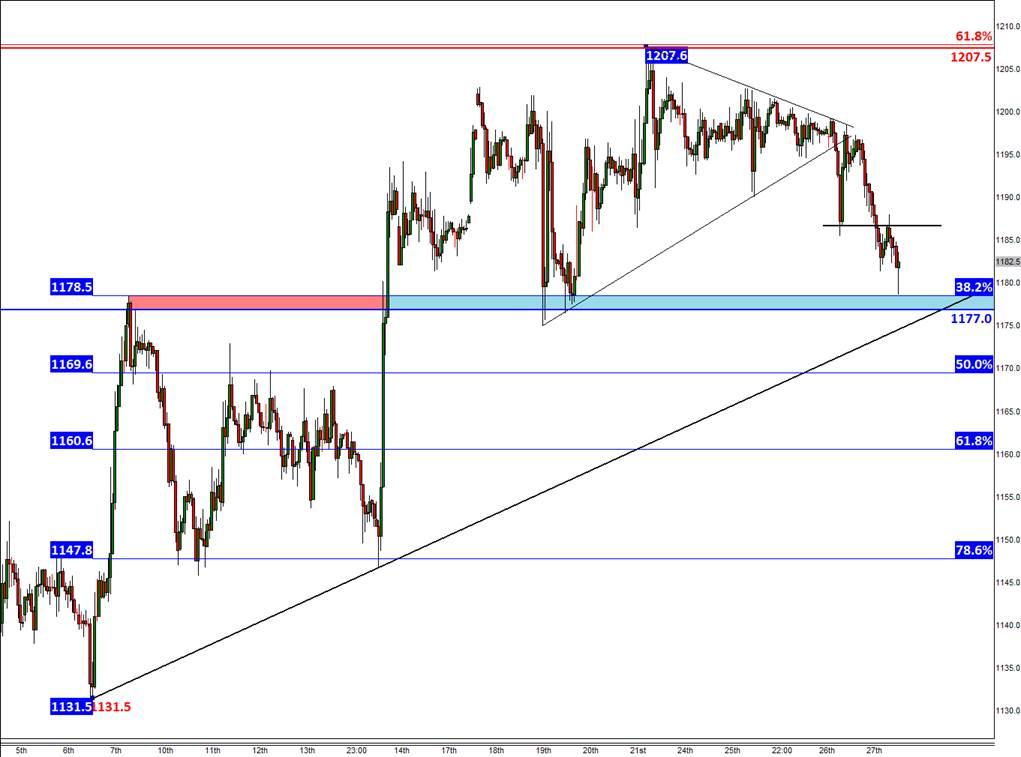
Meanwhile on the 1-hour chart (figure 2), the short-term bullish trend is still intact. Price is holding above the shallow 38.2% Fibonacci retracement level of the up move from this month’s low, at $1178.5; support around $1177.0, and a short-term bullish trend circa $1175. Thus a potential break below $1175 would be a bearish development. In that case, gold could easily drop to the 61.8% Fibonacci retracement at $1160.5 before deciding on its next move. The 78.6% Fibonacci level comes in at $1148 and the monthly low or the 100% retracement level is at $1131.5.
Trading leveraged products such as FX, CFDs and Spread Bets carry a high level of risk which means you could lose your capital and is therefore not suitable for all investors. All of this website’s contents and information provided by Fawad Razaqzada elsewhere, such as on telegram and other social channels, including news, opinions, market analyses, trade ideas, trade signals or other information are solely provided as general market commentary and do not constitute a recommendation or investment advice. Please ensure you fully understand the risks involved by reading our disclaimer, terms and policies.
Recommended Content
Editors’ Picks
EUR/USD clings to modest gains above 1.0650 ahead of US data

EUR/USD trades modestly higher on the day above 1.0650 in the early American session on Tuesday. The upbeat PMI reports from the Eurozone and Germany support the Euro as market focus shift to US PMI data.
GBP/USD extends rebound, tests 1.2400

GBP/USD preserves its recovery momentum and trades near 1.2400 in the second half of the day on Tuesday. The data from the UK showed that the private sector continued to grow at an accelerating pace in April, helping Pound Sterling gather strength against its rivals.
Gold flirts with $2,300 amid receding safe-haven demand

Gold (XAU/USD) remains under heavy selling pressure for the second straight day on Tuesday and languishes near its lowest level in over two weeks, around the $2,300 mark in the European session. Eyes on US PMI data.
Here’s why Ondo price hit new ATH amid bearish market outlook Premium

Ondo price shows no signs of slowing down after setting up an all-time high (ATH) at $1.05 on March 31. This development is likely to be followed by a correction and ATH but not necessarily in that order.
US S&P Global PMIs Preview: Economic expansion set to keep momentum in April

S&P Global Manufacturing PMI and Services PMI are both expected to come in at 52 in April’s flash estimate, highlighting an ongoing expansion in the private sector’s economic activity.

