Gold for Friday February 27, 2015
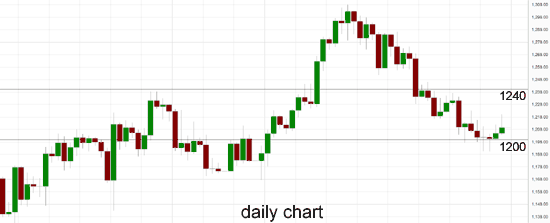
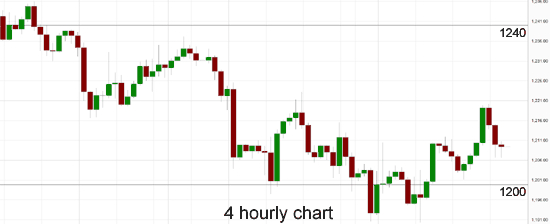
Gold has done well over the last few days to enjoy some support at $1200 and rally higher to a one week high at $1220 before easing in recent hours. It is presently trading in a narrow range right below $1210 after easing back from $1220. For the last month now gold has drifted steadily lower down to a one month low near the key $1200 level before finding solid support at this key level over the last week.
A few days ago we saw gold move back and forth and tease the $1200 level a little however the demand kicked in and brought it right back above the key $1200 level before moving a little higher in the last 24 hours. A couple of weeks ago it rallied higher after dropping through $1220 before running into some resistance around the key $1240 level.
The last month or so has now undone some great work earlier in the year which saw it surge to a five month high near $1308, before reversing and moving back to $1200. It presently finds itself trading in a narrow range right around $1200 where it is experiencing solid support. A few weeks ago gold eased back a little and steadied below the $1280 level after surging to that area and a four month high, before its recent strong surge higher.
At the beginning of December gold eased lower away from the resistance level at $1240 yet again back down to below $1200. During the second half of November gold made repeated runs at the resistance level at $1200 failing every time, before finally breaking through strongly. Throughout the first half of November gold enjoyed a strong resurgence back to the key $1200 level where it has met stiff resistance up until recently.
Throughout the second half of October gold fell very strongly and resumed the medium term down trend falling from above $1250 back down through the key $1240 level, down below $1200 to a multi-year low near $1130. It spent a few days consolidating around $1160 after the strong fall which has allowed it to rally higher in the last couple of weeks.
Earlier in October gold ran into the previous key level at $1240, however it also managed to surge higher to a five week high at $1255. In late August gold enjoyed a resurgence as it moved strongly higher off the support level at $1275, however it then ran into resistance at $1290. In the week prior, Gold had been falling lower back towards the medium term support level at $1290 however to finish out last week it fell sharply down to the previous key level at $1275.
Gold pared gains on Thursday after stronger-than-expected U.S. data lifted the dollar and impetus from Chinese buying petered out, but it remained higher after the Federal Reserve indicated this week that it was in no rush to raise interest rates. The dollar rose against a currency basket as data on U.S. durable goods orders in January beat forecasts, boosting confidence in business activity despite worries of the recent surge in the dollar hurting exports.
That weighed on gold, which is priced in the U.S. unit. Spot gold was up 0.5 percent at $1,210 an ounce. Earlier it hit a session high of $1,220.00 above the 100-day moving average at $1,216.20, before retreating as the dollar firmed. “The market feels a bit top heavy,” MKS head of trading Afshin Nabavi said. “We’ve had good buying of physical gold from the Far East as China opened up after the Lunar Week holiday, but above $1,210-1,212, that stopped.”
Gold prices have fallen around 10 percent over the last year, largely due to the prospect of higher U.S. rates, which would increase the opportunity cost of holding non-yielding bullion, while boosting the dollar.
(Daily chart / 4 hourly chart below)


Gold Technicals:
| S3 | S2 | S1 | R1 | R2 | R3 |
| 1200 | 1170 | — | 1240 | 1300 | — |
During the early hours of the Asian trading session on Friday, gold is trading in a narrow range right below $1210 after easing back from a short surge up to $1220. Current range: trading right around $1210.
Further levels in both directions:
• Below: 1200 and 1170.
• Above: 1240 and 1300.
OANDA’s Open Position Ratios
![]()
(Shows the ratio of long vs. short positions held for Gold among all OANDA clients. The left percentage (blue) shows long positions; the right percentage (orange) shows short positions).
The long position ratio for Gold has moved back below 70% as it has dropped sharply back to near $1200. The trader sentiment is in favour of long positions.
Economic Releases
- 00:05 UK GfK Consumer Confidence (Feb)
- 00:30 AU Private Sector Credit (Jan)
- 05:00 JP Housing starts (Jan)
- 05:00 JP Housing starts (Ann.) (Jan)
- 06:00 JP Construction orders (Jan)
- 09:30 UK GDP (2nd Est.) (Q4)
- 09:30 UK Index of Services (Dec)
- 13:30 US Core PCE Price Index (2nd Est.) (Q4)
- 13:30 US GDP Annualised (2nd Est.) (Q4)
- 13:30 US GDP Price Index (2nd Est.) (Q4)
- 14:45 US Chicago PMI (Feb)
- 15:00 US Pending Home Sales (Jan)
- 15:00 US Univ of Mich Sent. (Final) (Feb)
