


Talking Points:
- US Dollar Moves to Challenge Critical 6-Year Resistance Point
- S&P 500 Continues Choppy Consolidation Under 2100 Figure
- Crude Oil Locked in Range Above $47, Gold Stuck Below $1300
Can’t access the Dow Jones FXCM US Dollar Index? Try the USD basket on Mirror Trader. **
US DOLLAR TECHNICAL ANALYSIS – Prices are testing pivotal resistance marked by a peak dating back to March 2009. This barrier is reinforced by the 38.2% Fibonacci expansion at 11888, with a break below that on a daily closing basis exposing the 50% level at 11983. Alternatively, a turn below the 23.6% Fib at 11722 clears the way for a test of resistance-turned-support at 11715.
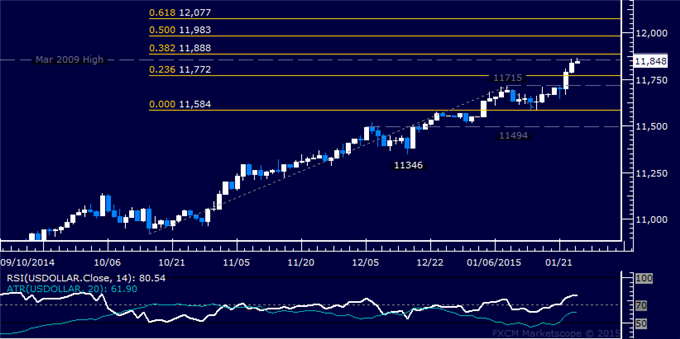
Daily Chart - Created Using FXCM Marketscope
** The Dow Jones FXCM US Dollar Index and the Mirror Trader USD basket are not the same product.
S&P 500 TECHNICAL ANALYSIS – Prices declined as expected after putting in a bearish Evening Star candlestick pattern. A daily close below the 23.6% Fibonacci expansion at 2040.60 exposes the 38.2% level at 2023.60. Alternatively, a turn back above the 14.6% Fib at 2051.10 aims for the January 23 high at 2068.10.
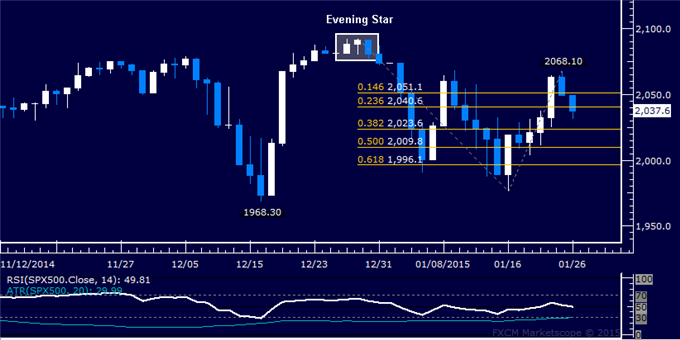
Daily Chart - Created Using FXCM Marketscope
GOLD TECHNICAL ANALYSIS – Prices continue to tread water near the $1300/oz figure. A daily close above the 123.6% Fibonacci expansion at 1300.39 exposes the 138.2% level at 1316.16. Alternatively, a turn back below the 100% Fib at 1274.89 targets the 1249.39-55.20 area marked by the 76.4% expansion and the October 21 high.
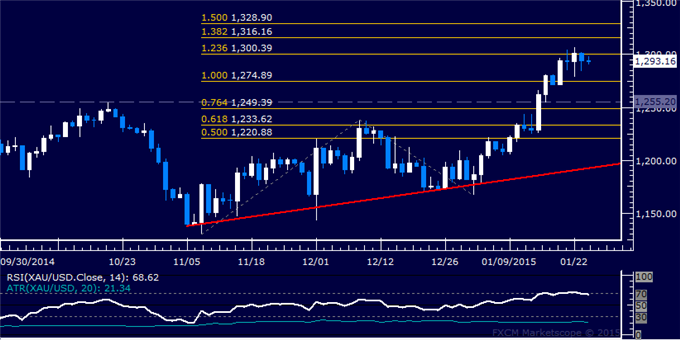
Daily Chart - Created Using FXCM Marketscope
CRUDE OIL TECHNICAL ANALYSIS – Prices are stalling having attempted to recover as expected. A daily close above the 14.6% Fibonacci retracement at 50.49 exposes the 23.6% level at 53.77. Alternatively, a reversal below the 14.6% Fib expansion at 47.07 targets the 23.6% threshold at 43.79.
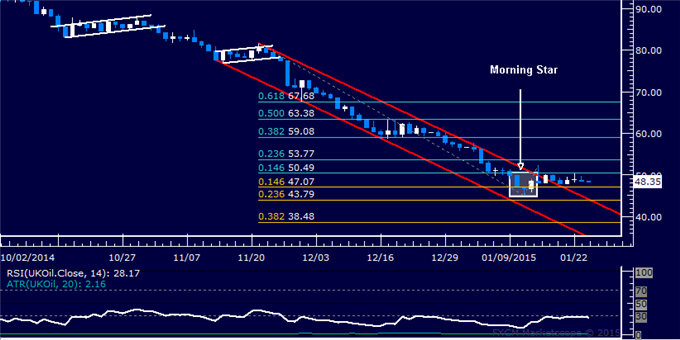
Daily Chart - Created Using FXCM Marketscope
--- Written by Ilya Spivak, Currency Strategist for DailyFX.com
To receive Ilya's analysis directly via email, please SIGN UP HERE
Contact and follow Ilya on Twitter: @IlyaSpivak


