Gold for Monday, December 15, 2014
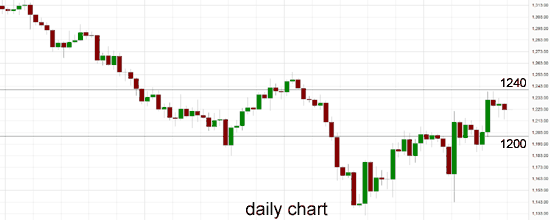
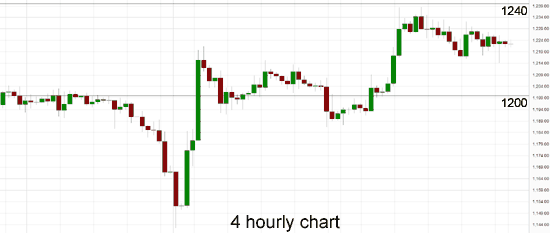
The last week has seen gold ease lower away from the resistance level at $1240 back down to find support at the previous short term resistance level of $1220. Gold enjoyed a solid surge higher up from the key $1200 level to a new six week high just shy of a previous resistance level at $1240 earlier last week. Gold has had a fascination with the $1200 level over the last month which has seen it trade either side of this level. During the second half of November gold made repeated runs at the resistance level at $1200 failing every time, before finally breaking through strongly. Since that time it has returned to back above $1220 before easing lower. Throughout the first half of November Gold enjoyed a strong resurgence back to the key $1200 level where it has met stiff resistance up until recently.
Throughout the second half of October gold fell very strongly and resumed the medium term down trend falling from above $1250 back down through the key $1240 level, down below $1200 to a multi year low near $1130. It spent a few days consolidating around $1160 after the strong fall which has allowed it to rally higher in the last couple of weeks. Earlier in October Gold ran into the previous key level at $1240, however it also managed to surge higher to a five week high at $1255. In late August Gold enjoyed a resurgence as it moved strongly higher off the support level at $1275, however it then ran into resistance at $1290. In the week prior, Gold had been falling lower back towards the medium term support level at $1290 however to finish out last week it fell sharply down to the previous key level at $1275.
During the second half of June, gold steadily moved higher but showed numerous incidents of indecision with its multiple doji candlestick patterns on the daily chart, around $1320 and $1330. At the beginning of June, gold did very well to repair some damage and return to the key $1275 level, then it has continued the momentum pushing a higher to its recent four month high. After moving so little for an extended period, gold dropped sharply back in May from above the well established support level at $1275 as it completely shattered this level falling to a four month low around $1240. It remained around support at $1240 for several days before its strong rally higher. It pushed down towards $1280 before sling shotting back and also had an excursion above $1300 for a short period before moving quickly back to the $1293 area again.
Gold prices fell on Friday, on track for their biggest weekly rise since June, as the dollar retreated and sliding oil prices hurt risk appetite, prompting another drop in stocks. Gold is up nearly 3 percent so far this week. Weakness in stocks has prompted some investors to buy the metal as an alternative asset, while a drop in the U.S. unit made dollar-priced bullion cheaper for other currency holders. Spot gold was last down 0.8 percent at $1,218 an ounce, while U.S. gold futures for December delivery were down 0.6 percent at $1,216 an ounce. “Gold and silver have both had a very good week, going against the trend seen elsewhere,” Saxo Bank’s head of commodity research Ole Hansen said. “We have reached levels which short sellers have been attracted to in the past and this may slow the positive momentum that has emerged during the past week.” “Overall there is a feeling out there that traders are now going defensive on their positions and this is weakening the dollar, thereby adding some support to precious metals.”
Gold December 14 at 23:00 GMT 1222.5 H: 1228.3 L: 1214.4
Gold Technical
| S3 | S2 | S1 | R1 | R2 | R3 |
| 1200 | 1130 | — | 1240 | 1255 | — |
During the early hours of the Asian trading session on Monday, Gold is consolidating just above $1220 after easing back away from the resistance level at $1240 over the last few days. Current range: trading above $1220.
Further levels in both directions:
• Below: 1200 and 1130.
• Above: 1240 and 1255.
OANDA’s Open Position Ratios
![]()
(Shows the ratio of long vs. short positions held for Gold among all OANDA clients. The left percentage (blue) shows long positions; the right percentage (orange) shows short positions.)
The long position ratio for Gold has moved back up towards 55% again as gold has eased lower again. The trader sentiment is ever so slightly in favour of long positions.
Economic Releases
- 00:01 UK Rightmove House Price Index (Dec)
- 00:30 AU New motor vehicle sales (Nov)
- 00:30 AU RBA minutes released
- 13:30 US Empire State Survey (Dec)
- 14:15 US Capacity utilisation (Nov)
- 14:15 US Industrial production (Nov)
- 15:00 US NAHB Builders survey (Dec)
- 21:00 US Net Long-term TICS Flows (Oct)
- EU EU Foreign Ministers Hold Meeting in Brussels


