
Price pattern Analysis for US Dollar, Gold, S&P 500 and Grude Oil

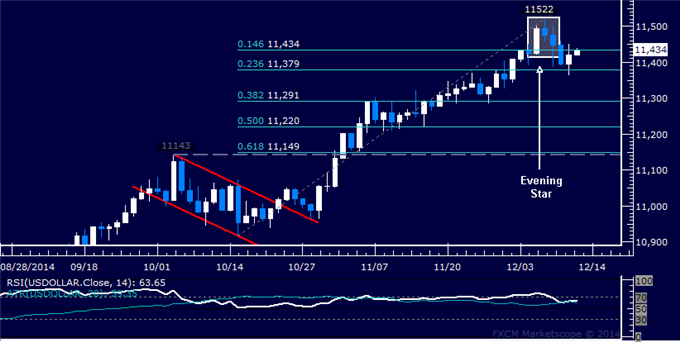
US DOLLAR TECHNICAL ANALYSIS
Prices moved lower as expected
after prices put in a bearish Evening Star candlestick pattern. A daily
close below the 23.6% Fibonacci retracementat 11379 exposes the 38.2%
level at 11291.
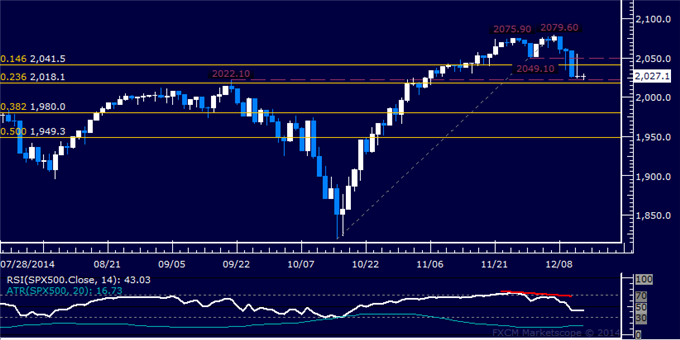
S&P 500 TECHNICAL ANALYSIS
Prices turned lower as expected,
issuing the largest decline in two months. A push below the
2018.10-22.10areamarked by the 23.6%Fibonacci retracementand
theSeptember 19 highexposes the 38.2% level at 1980.00.
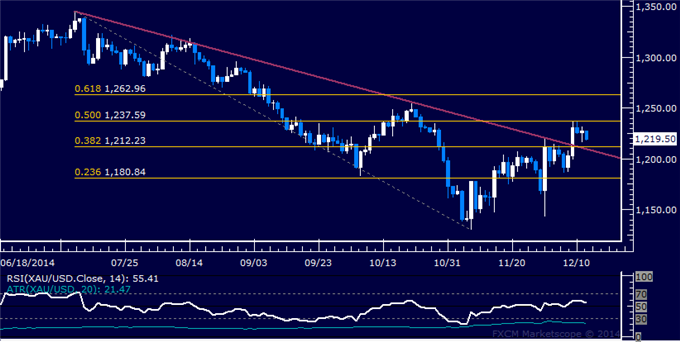
GOLD TECHNICAL ANALYSIS
Prices paused to consolidate after
clearing resistance at a falling trend line set from early July. A break
above the 50% Fibonacci retracement at 1237.59 on a daily closing basis
exposes the 61.8% level at 1262.96.
CRUDE OIL TECHNICAL ANALYSIS
Prices continued to move lower
after yesterday’s brief respite, with sellers now eyeing the 76.4%
Fibonacci expansion at 62.25. A break below that on a daily closing
basis exposes the 100% level at 58.93.


