


Talking Points:
- US Dollar Pauses to Digest Losses After Hitting 4-Month Low
- S&P 500 Signals Indecision at Familiar Range Top Resistance
- Gold Working to Extend Rebound, Crude Oil Treading Water
Can’t access the Dow Jones FXCM US Dollar Index? Try the USD basket on Mirror Trader. **
US DOLLAR TECHNICAL ANALYSIS – Prices remain in digestion mode after prices slid to the four-month low. A daily close below the 61.8% Fibonacci expansion at 11638 exposes the 76.4% level at 11576. Alternatively, a push above the 50% Fib at 11688 opens the door for a challenge of the 38.2% threshold at 11737.
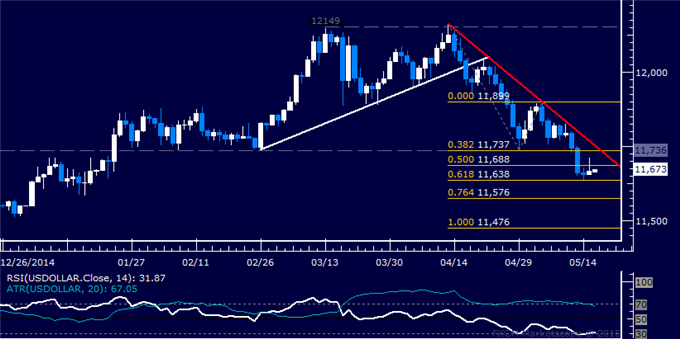
Daily Chart - Created Using FXCM Marketscope
** The Dow Jones FXCM US Dollar Index and the Mirror Trader USD basket are not the same product.
S&P 500 TECHNICAL ANALYSIS – Prices continue to jostle around in a choppy range, waiting for clear-cut direction cues. A daily close above the 2122.10-25.90 area (April 27 high, 38.2% Fibonacci expansion) exposes the 50% level at 2140.70. Alternatively, a reversal below the 23.6% Fib at 2099.10 targets the 14.6% expansion at 2084.90.

Daily Chart - Created Using FXCM Marketscope
GOLD TECHNICAL ANALYSIS – Prices are working on the fifth consecutive day on the upside. A break above the 76.4% Fibonacci expansion at 1231.71 exposes the 100% level at 1250.96. Alternatively, a turn below the 61.8% Fib at 1219.80 targets the 50% expansion at 1210.18.

Daily Chart - Created Using FXCM Marketscope
CRUDE OIL TECHNICAL ANALYSIS – Prices are stalling having rebounded from support above the $64.00 figure. A daily close above the 23.6% Fibonacci expansion at 68.23 exposes the May 6 high at 69.60, followed by the 38.2% level at 70.72. Alternatively, a turn below the 14.6% Fib retracement at 66.03 targets the 23.6% threshold at 63.84.

Daily Chart - Created Using FXCM Marketscope
--- Written by Ilya Spivak, Currency Strategist for DailyFX.com
To receive Ilya's analysis directly via email, please SIGN UP HERE
Contact and follow Ilya on Twitter: @IlyaSpivak


