It's probably time to stand back and take a look at where the S&P and VIX are at now after the market's first bad week it has had since the early October plunge. Both the S&P and the VIX closed out the week at key levels in the moving averages and trend lines.

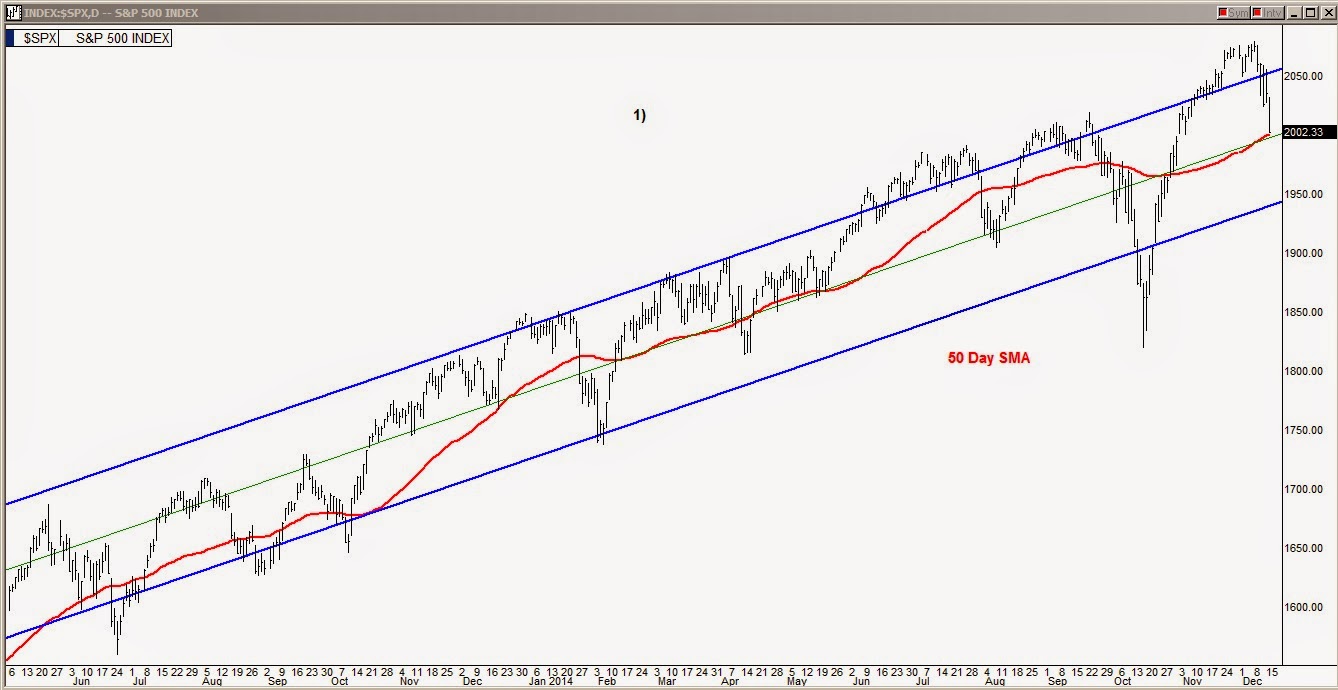
Looking at the chart above, the S&P closed right at its 50 day simple moving average line. The 2002 closing number is also the center line of the midterm channel (shown with fine green line) and also, 2002 is essentially the big round 2000 level benchmark. Dropping through any of these three on Monday could bring in another wave of selling. One would think, however, that there would be support for at least a couple of days of sideways trading here but it's a risk to bet either way just yet.

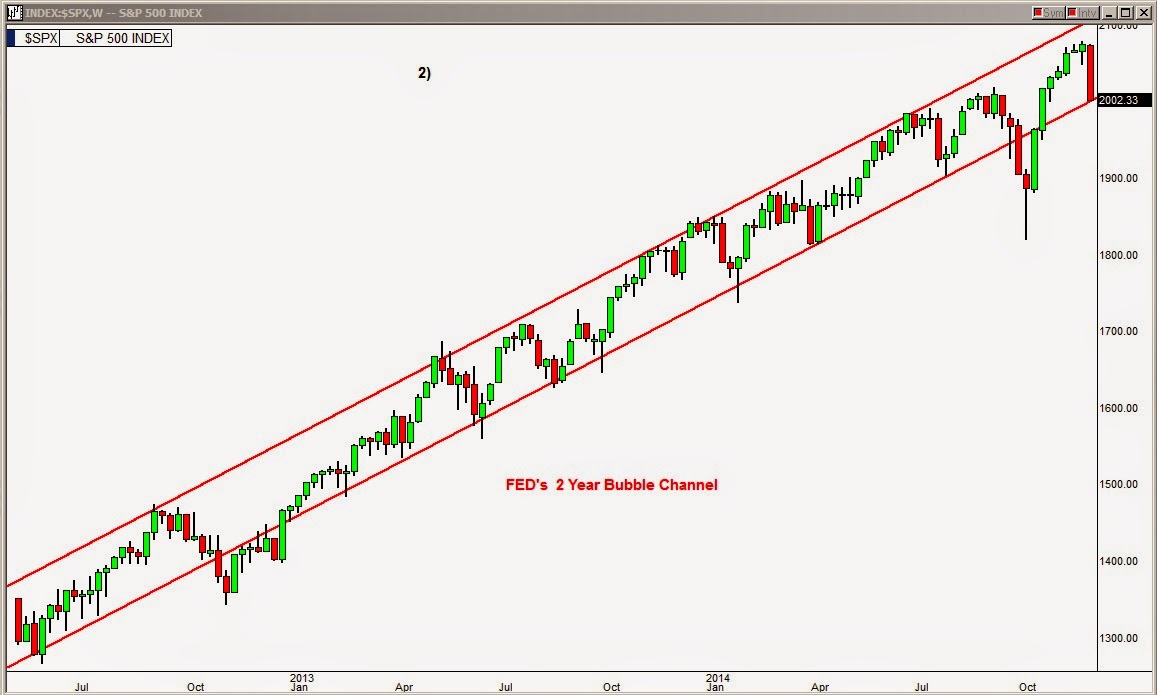
In chart 2 above, the two year Fed bubble channel is shown and today's 2002 S&P closing is right at the lower line of this channel. If we breach that line Monday, once again another wave of selling could be triggered because of this chart. As in the daily chart it would be reasonable to think that there would be at least temporary support here but we will just have to see.

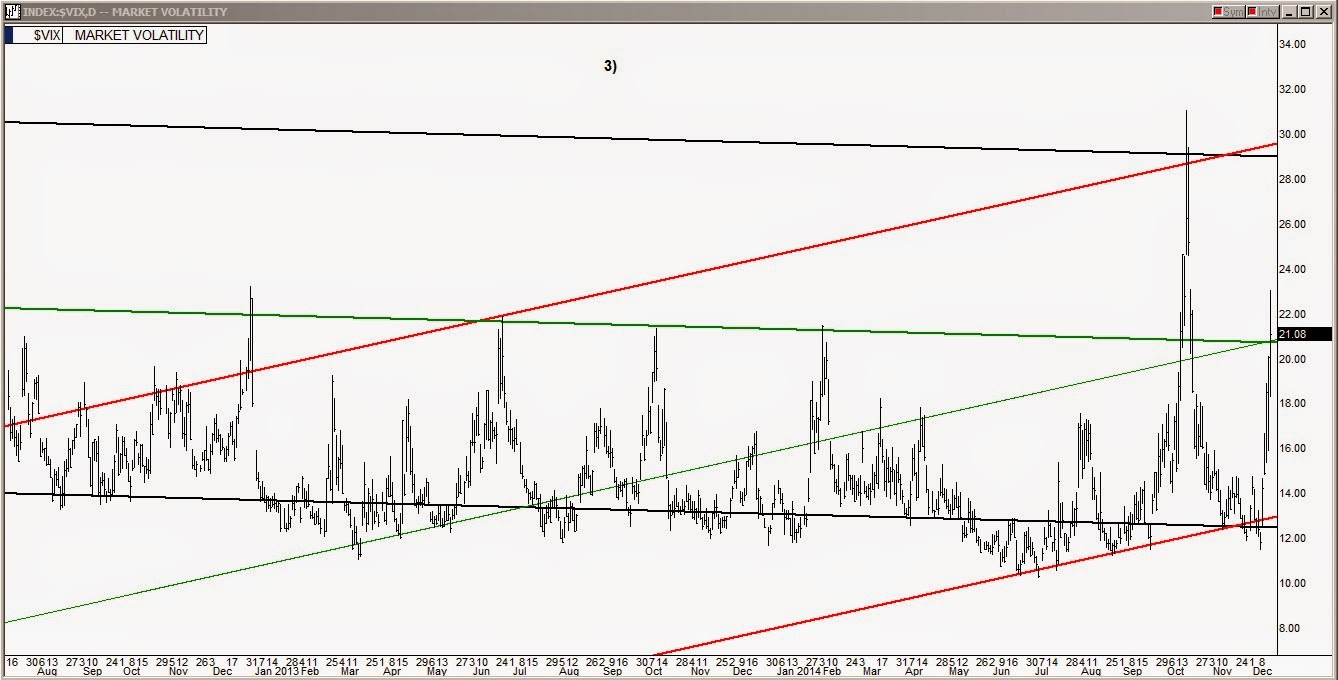
The above chart is of the VIX (Volatility Index) showing that the VIX closed at the key 21 level which is the center line of the long term slightly downhill channel (shown in black) and also the center line of the newly forming uphill red line channel. The S&P did pop across both center lines in the last hour Friday but returned back to the center lines for the close. That little blip was actually triggered off of intraday technicals on the VXX (VIX Short Term Futures ETF). I don't think too much meaning should be read into it as far as if it might be looked at a hard test of the center line, it looks like closing right at the lines is a truly neutral pivot with a move Monday either way being capable of swaying the crowd.

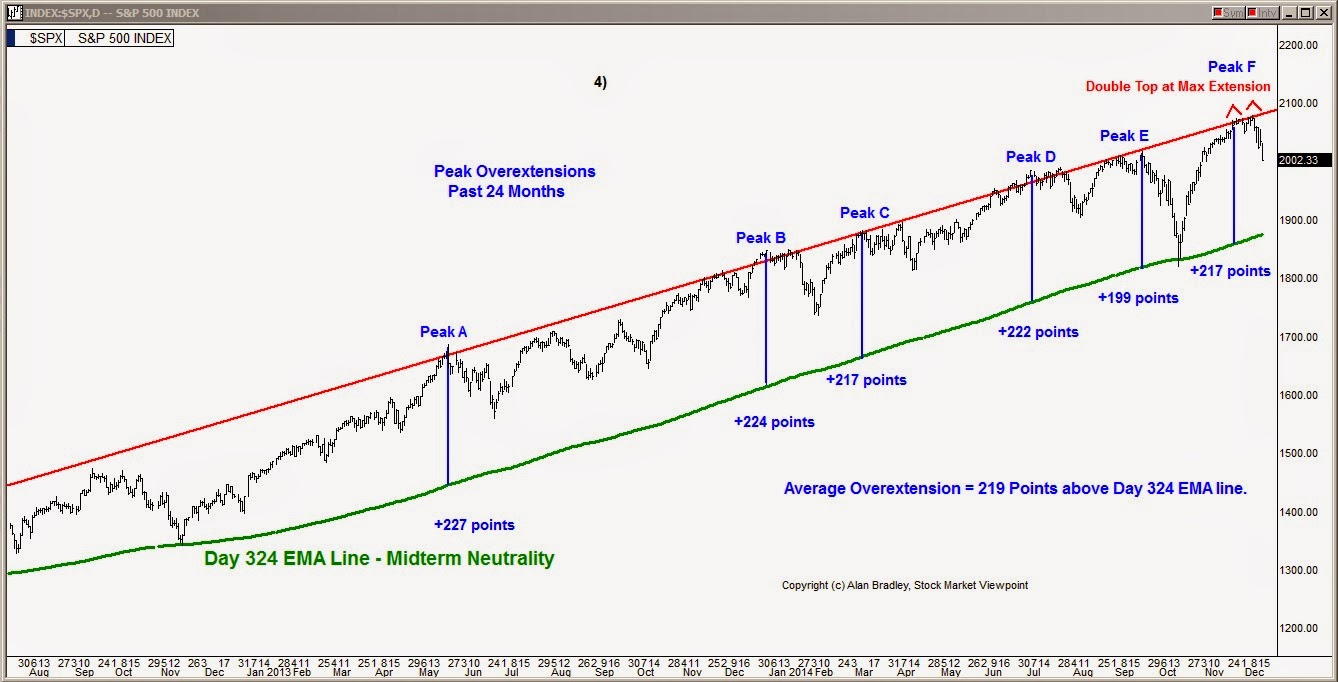
Finally, taking a look at chart 4, the S&P over-extension chart, we see that it put in a double top at the maximum extension level. Normally, they prop the market up in a sideways trend for a minimum of four weeks after first reaching the maximum extension level and then the fall begins. This time it was different, however, because it has only been propped against the maximum extension level for barely two weeks before the fall began which can be attributed to the bearish catalyst of plunging oil prices and its implications of a slowing global economy.
