The central bank high is euphoric, the crash and burn equally epic.
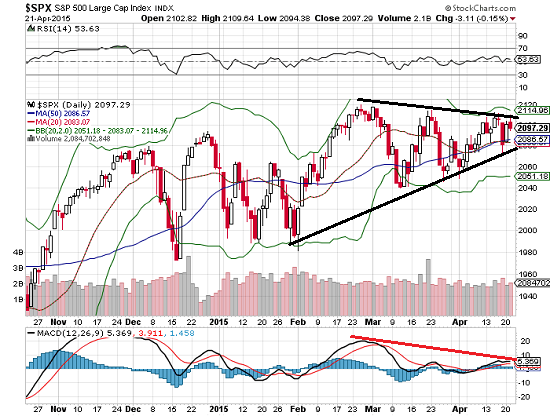
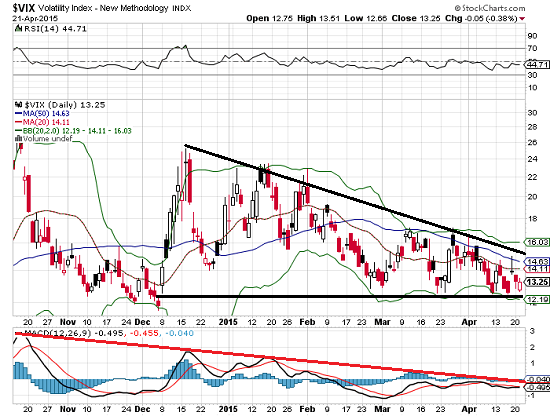
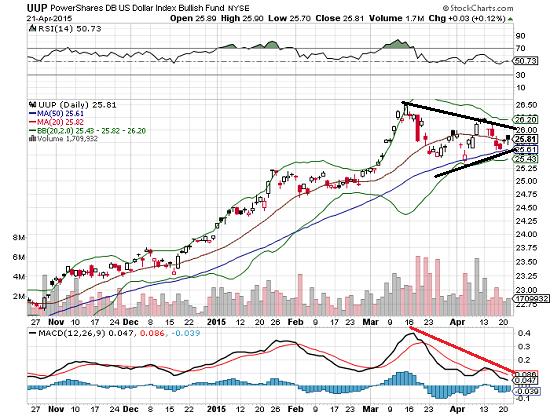
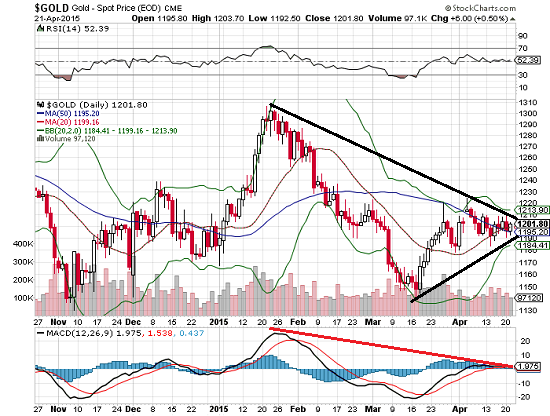
Just out of curiosity, I called up a few charts of key markets: stocks (the S&P 500), volatility (VIX), gold and the U.S. dollar (via PowerShares DB US Dollar Bullish (NYSE:UUP), an exchange-traded fund for the dollar). Interestingly, all of these charts displayed some version of a wedge/triangle.
In a wedge/triangle (a formation with many variations such as pennants), price traces out a pattern of higher lows and lower highs, compressing price action into the apex of a triangle as buyers and sellers reach an increasingly unstable equilibrium.
As price gets squeezed into a narrowing band, the likelihood increases that price will break out of the triangle, either up or down, in a major move.
So which way will these markets break--up or down? One thing is fairly certain: the S&P 500 (SPX) and the VIX (volatility) are on a see-saw--both don't soar at the same time. If the VIX soars, stocks are plummeting as fear takes hold. If the VIX stumbles along the bottom of its range, market players are complacent and stocks loft higher.
Many observers see the same inverse relationship in gold and the U.S. dollar--when one is going up, the other is weakening.
I tested this widely accepted truism by aligning the charts of both the U.S. dollar and gold, and found that there were lengthy periods during which gold and the U.S. dollar rose in tandem: About That Supposed Correlation of the U.S. Dollar and Gold.... (July 8, 2013)
My conclusion: each is influenced by a number of factors, some shared, some unique to each asset. As a result of this complex confluence, at times both go up together and at times there is a negative correlation (see-saw effect), and during other periods, there is little correlation, i.e. they act entirely independent of the other.
Let's look at the charts. Nothing fancy here--just clear wedges/triangles and declining MACD indicators.


Interestingly, gold rose when the VIX was elevated—that is, when market participants were nervous or fearful. If volatility breaks to the upside, stocks will fall and perhaps gold will move up as the flight to safety/fear trade replaces central-bank administered complacency that stocks can loft higher regardless of fundamentals.
Since the dollar also tends to strengthen when the herd is stampeding in a flight to safety, perhaps we can look to the VIX as the bellwether for what will likely happen to stocks, gold and the dollar.
If the risk-on central bank monetary cocaine trade continues, stocks may loft higher and the VIX, gold and the dollar may all drift lower as volatility and lower-risk assets are avoided in the quickening chase for yield in a negative-interest world.
If the risk-on trade evaporates and risk-off trades gain favor, stocks will be sold off hard, volatility will rocket higher (something we've almost forgotten can happen) and gold and the U.S. dollar will benefit from the flight to safety/central bank cocaine crash trade.
The central bank high is euphoric, the crash and burn equally epic. Be careful what monkey you invite to latch onto your back....
