Gold for Tuesday, September 2, 2014
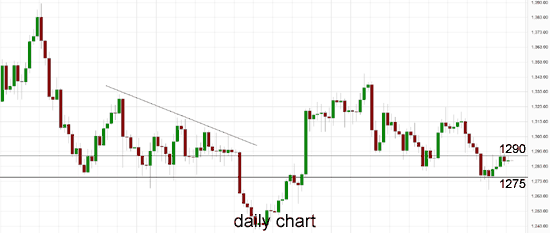
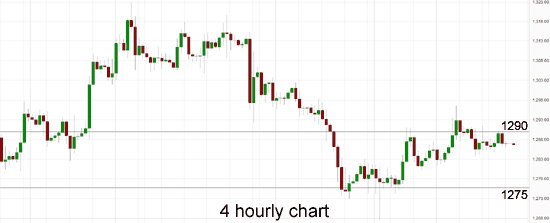
Over the last week Gold enjoyed a resurgence as it moved strongly higher off the support level at $1275, however over the last few days it has been running into resistance at $1290. In the week prior, Gold had been falling lower back towards the medium term support level at $1290 however to finish out last week it fell sharply down to the previous key level at $1275. Both of these levels continue to play a role yet the overall longer term trend is still down so it is reasonable to expect the $1275 to come under pressure again soon. A couple of weeks ago Gold was meeting resistance around $1313 which saw it finally ease lower. Just prior to that it moved well away from the support level at $1290 and back up well above $1300 to a two week high above $1322 before easing lower. It had also been easing lower and placing pressure on the support level at $1300 which eventually gave way resulting in gold falling sharply back down to a six week low near $1280 a few weeks ago. Over the last month or so the $1290 level has shown some signs of support and held gold up until its recent fall. During the second half of June, gold steadily moved higher but showed numerous incidents of indecision with its multiple doji candlestick patterns on the daily chart. This happened around $1320 and $1330.
The OANDA long position ratio for Gold has eased back towards 70% as gold has moved up towards $1290. At the beginning of June, gold did very well to repair some damage and return to the key $1275 level, then it has continued the momentum pushing a higher to its recent four month high. After moving so little for an extended period, gold dropped sharply back in May from above the well established support level at $1275 as it completely shattered this level falling to a four month low around $1240. It remained around support at $1240 for several days before its strong rally higher. It pushed down towards $1280 before sling shotting back and also had an excursion above $1300 for a short period before moving quickly back to the $1293 area again. Over the last few weeks gold has eased back from around $1315 to establish its recent narrow trading range below $1295 before its recent slump.
Way back since March, the $1275 level has established itself as a level of support and on several occasions has propped up the price of gold after reasonable falls. Throughout the second half of March gold fell heavily from resistance around $1400 back down to a several week low near support at $1275. Both these levels remain relevant as $1275 continues to offer support and the $1400 level is likely to play a role again should gold move up higher. Through the first couple of months of this year, gold moved very well from a longer term support level around $1200 up towards a six month higher near $1400 before returning to its present trading levels closer to $1300.
Goldfailed to find support from the escalating geopolitical tensions in Ukraine as a stronger dollar offset the metal's safe-haven appeal. Spot gold was steady at $1,287.70 an ounce, after posting a small gain last week. The dollar index was trading near a 13-month high, hurting bullion. Higher equities have also diminished the appetite for gold. SPDR Gold Trust (ARCA:GLD), the world's largest gold-backed exchange-traded fund and a gauge of investor demand, said its holdings fell 0.08 percent to 795 tonnes on Friday. Hedge funds and money managers decreased their bullish futures and option bets in gold for a second consecutive week as a record rally in U.S. equities sapped demand for the safe-haven metal, data from the Commodity Futures Trading Commission showed on Friday. Physical demand for bullion remained subdued, with the U.S. Mint seeing a 17 percent month-on-month drop in sales of American Eagle gold coins in August.


Gold September 2 at 00:50 GMT 1286.5 H: 1290.1 L: 1284.8
Gold Technical
| S3 | S2 | S1 | R1 | R2 | R3 |
| 1275 | 1240 | --- | 1290 | 1330 | --- |
During the early hours of the Asian trading session on Tuesday, Gold is trading just below the key $1290 level after moving up in the last few days. Current range: trading right around $1287.
Further levels in both directions:
• Below: 1275 and 1240.
• Above: 1290 and 1330.
OANDA's Open Position Ratios
(Shows the ratio of long vs. short positions held for Gold among all OANDA clients. The left percentage (blue) shows long positions; the right percentage (orange) shows short positions.)
The long position ratio for Gold has eased back towards 70% as gold has moved up towards $1290. The trader sentiment is strongly in favour of long positions.
Economic Releases
- 23:30 (Mon) AU AIG Services PMI (Aug)
- 01:00 NZ ANZ Commodity Price (Aug)
- 01:30 AU Building approvals (Jul)
- 01:30 AU Current Account
- 01:30 AU Net Exports of GDP (Q2)
- 04:30 AU RBA - Overnight Rate
- 08:30 UK CIPS/Markit Construction PMI (Aug)
- 09:00 EU PPI (Jul)
- 13:45 US Manufacturing PMI (Aug)
- 14:00 US Construction Spending (Jul)
- 14:00 US ISM Manufacturing (Aug)
